# The refinement result
This page gives what a `RefinementResult` carries beside the refined values: the agreement statistics, the structure R-factors, the observation count, the identifiability evidence, the restraint and absorption records and the diagnostics, then how a result prints.
`Refinement.fit` and `refine` return a `RefinementResult`.
[API: everyday calls](api.html.md#results) lists every field.
The refined values are `RefinementResult.parameters`, one row per parameter with its esd, and `RefinementResult.parameter` looks one up by path.
[Derived quantities](derived.html.md) gives the distances, angles, cell volumes, sizes and strains a fit computes from them.
The IUCr guidelines rank this evidence differently from a table of R values.
The two most important criteria for judging a refinement are the fit of the calculated pattern to the observed one and “the chemical sense of the structure” [[McCusker *et al.*, 1999](../theory/references.html.md#id9)].
Rwp is half of the first.
Each formula this page names is a numbered equation in Theory.
## Fit statistics
`RefinementResult.statistics` is a `Statistics` object.
The definitions follow Toby [[Toby, 2006](../theory/references.html.md#id73)], and [Agreement statistics](../theory/estimation.html.md#agreement-statistics) gives them as equation [(8.2)](../theory/estimation.html.md#equation-est-indices).
| Field | Is | Reads as |
|---|---|---|
| `Statistics.rwp` | the weighted profile R-factor | how well the calculated pattern matches the measured one, weighted by the counting statistics; a fraction, so 0.0933 is 9.3 % |
| `Statistics.rp` | the unweighted profile R-factor | the same comparison with every point weighted equally, so strong peaks dominate it |
| `Statistics.rexp` | the expected R-factor | the Rwp that counting statistics alone would produce; a property of the data and the parameter count, and independent of the model |
| `Statistics.chi2` | the reduced χ², Σw δ²/(N − P) | how far the fit is from statistical perfection; 1.0 means the residual is the size of the noise |
| `Statistics.gof` | Rwp / Rexp | the square root of `Statistics.chi2`, also called S or χ |
| `Statistics.rwp_background_subtracted` | Rwp with the background removed from both patterns | the more meaningful figure when the background carries most of the raw intensity |
| `Statistics.durbin_watson` | the serial-correlation statistic | about 2 when neighbouring residuals are independent; far from 2, the misfit is structured whatever Rwp says |
| `Statistics.esd_inflation` | the Bérar-Lelann factor | what the reported esds were multiplied by to account for that serial correlation; already applied |
| `Statistics.n_points`, `Statistics.n_free_parameters` | N and P | the counts the rest is read against |
| `Statistics.max_shift_over_esd` | the largest \|Δθ\|/esd over the last accepted step, both sides in the parameter’s own units | the convergence quantity: converged when at most 0.1 [[McCusker *et al.*, 1999](../theory/references.html.md#id9)] |
| `Statistics.identifiability_clause` | the report’s identifiability sentence, verbatim | the sentence the report’s summary carries, delivered beside the numbers |
`Statistics.chi2` is the reduced χ² and not Σw δ².
The two differ by a factor of N − P, which on a real pattern is several thousand.
The band on `Statistics.max_shift_over_esd` is quoted from the guidelines and gates nothing.
A converged stage meets it, so the number says most on a stage that stopped on its iteration budget: how far the solve was still moving, in esds.
It is `None` when it cannot be measured: no accepted step, no esds, or a replay.
A joint fit measures it over the joint parameter vector.
A `HistogramResult`’s own statistics leave it `None`, and `RefinementResult.for_histogram` carries the joint figure onto one histogram’s view.
`build_report` writes `Statistics.identifiability_clause`, and a fit alone leaves it `None`.
It is also `None` when nothing crossed a comment threshold.
Neither `None` is a verdict about the fit.
The evidence behind the sentence is `FitReport.identifiability` ([About the report](../concepts/report.html.md)).
Every figure in the block, and `RefinementResult.y_calc` beside it, is measured on a fresh compile at the values the result returns.
The last stage solved on a compile whose peak windows and quadrature node counts were frozen at the values the stage started from.
When the two χ² differ by more than 1 %, the result carries [`FROZEN_COMPILE_STALE`](diagnostics-refinement.html.md#frozen-compile-stale) with both figures in its message.
The esds are not re-measured.
They are the last solve’s, read off its Jacobian, and the history node keeps the frozen compile’s figures.
Two results report the frozen compile’s figures and never carry `FROZEN_COMPILE_STALE`.
One is a Pawley result, whose intensity block belongs to the solve.
The other is a joint fit, which `rietx.multi` builds itself.
The literature is not consistent about which quantity is called χ².
The IUCr guidelines [[McCusker *et al.*, 1999](../theory/references.html.md#id9)] write χ² = Rwp/Rexp and say it should approach 1.
That quantity is `Statistics.gof` here, and `Statistics.chi2` is its square.
Both conventions say the same thing about a fit, and the naming here follows Toby [[Toby, 2006](../theory/references.html.md#id73)].
A number copied from a paper needs its convention copied with it.
`Statistics.esd_inflation` does not reach 1 even on a perfect fit.
Perfectly white residuals land near 1.13, because same-sign neighbours happen by chance, so a value near that is no evidence of serial correlation.
Lab data with unmodelled profile detail lands near 2 to 3.
It is Bérar and Lelann’s homogeneous correction, one scalar for every parameter ([Esds and the Bérar-Lelann inflation](../theory/estimation.html.md#esds-and-the-berar-lelann-inflation)).
Treat it as a measure of how correlated the residual is, and not as a calibrated per-parameter uncertainty.
### Limits of the agreement statistics
The statistics measure agreement, and agreement is not correctness.
A background flexible enough to imitate the peaks biases displacement parameters up and phase fractions down while Rwp improves.
Of the eight corrections shipped in v0.5, two provably cannot move Rwp, one moves it the wrong way when it is right, and the two largest accuracy wins are invisible in it.
That is what [the report](../concepts/report.html.md) is for.
It is also why a correction in rietx ships with a record field or a diagnostic saying what it changed, such as the [absorption record](), rather than with an Rwp comparison as its evidence.
## Structure agreement indices
The statistics above measure the pattern.
Two more measure the structure, and a journal asks for at least one of them [[McCusker *et al.*, 1999](../theory/references.html.md#id9)].
They are on `RefinementResult.phase_agreement`, one `PhaseAgreement` row per phase, keyed by `PhaseAgreement.name`, the name the phase carries everywhere else.
[Structure agreement indices](../theory/estimation.html.md#structure-agreement-indices) defines both as equation [(8.3)](../theory/estimation.html.md#equation-est-structure-r).
| Field | Is | Reads as |
|---|---|---|
| `PhaseAgreement.r_bragg` | RB, the Bragg-intensity R-factor | how well the model reproduces the integrated intensities I = m·F², with m the multiplicity; written to a CIF as `_refine_ls_R_I_factor` |
| `PhaseAgreement.r_f` | RF, the structure-factor R-factor | the same comparison on the amplitude, so it is the number a single-crystal R compares with directly; written as `_refine_ls_R_factor_all` |
| `PhaseAgreement.n_reflections` | how many reflections were summed | smaller than the phase’s reflection list whenever one falls off the Ewald sphere |
`PhaseAgreement.r_bragg` and `PhaseAgreement.r_f` are `None` for a phase with no scattering power to partition at all.
A joint multi-histogram fit reports the indices per histogram, on `HistogramResult.phase_agreement`.
The partition is of one pattern’s counts, so there is no pooled value.
A phase carrying a spherical-harmonics texture gets one more row, on `RefinementResult.texture`, one `PhaseTexture` per textured phase in a Rietveld fit.
These rows are the correction’s evidence, because Rwp is not.
| Field | Is | Reads as |
|---|---|---|
| `PhaseTexture.name` | the phase’s name | the key, as on `PhaseAgreement` |
| `PhaseTexture.texture_index` | J = 1 + Σ C²/(2l+1) | 1 for a random powder; a lower bound on the specimen’s, because odd orders and those past the declared order are not measured |
| `PhaseTexture.min_p_reflections` | the lowest multiplier P over the phase’s fitted reflections | the default driver holds it at 0 or above |
| `PhaseTexture.min_p_sphere` | the lowest P over directions sampled on the whole sphere, the reflections included | below zero, [`TEXTURE_NOT_POSITIVE`](diagnostics-refinement.html.md#texture-not-positive) fires and the coefficients are not a pole density |
A joint fit leaves `RefinementResult.texture` empty, because its shared coefficients meet each histogram at its own sample angle.
Both structure indices are biased towards the model you are testing.
A powder pattern does not measure individual reflection intensities, because overlapped peaks share their counts.
The “observed” intensity of each reflection is the observed pattern partitioned in proportion to the calculated one.
A wrong model therefore receives the intensity it predicted, and both indices flatter it.
That is the guidelines’ own warning, and it fixes what the indices are for: watching an RB fall as you improve a model, rather than judging a model in isolation.
A trace phase’s RB is not comparable with the major phase’s.
Neither index is weighted, so a reflection the fit barely constrains counts as much as one that dominates it.
A minor phase’s windows also sit under the major phase’s peaks, where the counts the major phase failed to describe are handed out too.
Measured on the 11-BM NAC pattern with its 1.34 wt % CaF₂ impurity, NAC reads RB 0.048 and the impurity 0.377.
The whole of the impurity’s misfit is in four reflections at I(obs)/I(calc) of 2.2 to 2.3, every one of them under a strong NAC peak with a large positive residual.
Read RB beside the phase’s weight fraction, and treat a trace phase’s value as a question rather than a measurement.
Both indices are absent, an empty list, for a Le Bail or Pawley fit.
There the intensities are the fit, so the partition would be compared against itself.
## Observation count
`Statistics.n_points` is the N the least-squares algorithm uses, and it is not the number of observations the pattern holds.
Only the integrated intensities of individual reflections are unique observations [[McCusker *et al.*, 1999](../theory/references.html.md#id9)].
The profile steps across one peak are repeated measurements of the same number.
So the algorithm will refine far more parameters than the data support without complaint, because its N runs into the thousands.
`RefinementResult.data_support` is a `DataSupport` object carrying the count that answers this.
[The effective observation count](../theory/estimation.html.md#the-effective-observation-count) states the correction it applies as equation [(8.4)](../theory/estimation.html.md#equation-est-mind).
| Field | Is | Reads as |
|---|---|---|
| `DataSupport.n_unique_reflections` | reflections this pattern measured, summed over phases | one symmetry orbit is one reflection, and a Kα doublet’s second line is the same reflection measured again; a reflection counts when a fitted channel lies within half its own FWHM of its position on any emission line, so an excluded region removes what sits under it and a peak half-measured at a range end still counts |
| `DataSupport.n_effective_observations` | the same count corrected for overlap | each reflection contributes the fraction of its own area on which no overlapping reflection stands higher, so an isolated line is worth 1 and an exactly coincident pair is worth 1 between the two of them; a float, because a partly resolved pair is worth more than one and less than two; `None` when no reflection was measured |
| `DataSupport.n_structural_parameters` | the free parameters the ratio is about | the atomic ones: coordinate degrees of freedom, occupancies, Biso and ADP components; the cell, zero, profile, background, scale, preferred orientation and extinction are excluded, because peak positions and shape determine those rather than the intensities being counted |
| `DataSupport.observations_per_parameter` | the raw count divided by the parameters | the upper bound on the ratio; `None` when no structural parameter is free, as in a profile-only stage, a Le Bail fit or a Pawley fit |
| `DataSupport.effective_observations_per_parameter` | the effective count divided by the parameters | the number the guideline is about: at least 3.0 and preferably 5.0 [[McCusker *et al.*, 1999](../theory/references.html.md#id9)]; `None` on the same terms as the row above |
`Statistics.n_free_parameters` minus `DataSupport.n_structural_parameters` is the rest: the profile, background and cell parameters.
The same fit refined them against the same pattern, but the peak positions and shapes determine them.
`RefinementResult.data_support` is present for anything with a compiled model behind it, a replay included.
It is `None` for a joint multi-histogram fit, which would need one count per histogram, and for a result recorded before v1.0.
`DataSupport.n_unique_reflections` over-counts on purpose.
Two reflections at the same 2θ are one observation, and both are counted here.
In a cubic cell that pair is common: (300) and (221) coincide exactly.
The raw count is therefore an upper bound on the information, and the ratio built from it is optimistic.
`DataSupport.n_effective_observations` is the corrected number, by the method of Altomare et al. [[Altomare *et al.*, 1995](../theory/references.html.md#id13)], and the gap between the two is the pattern’s overlap.
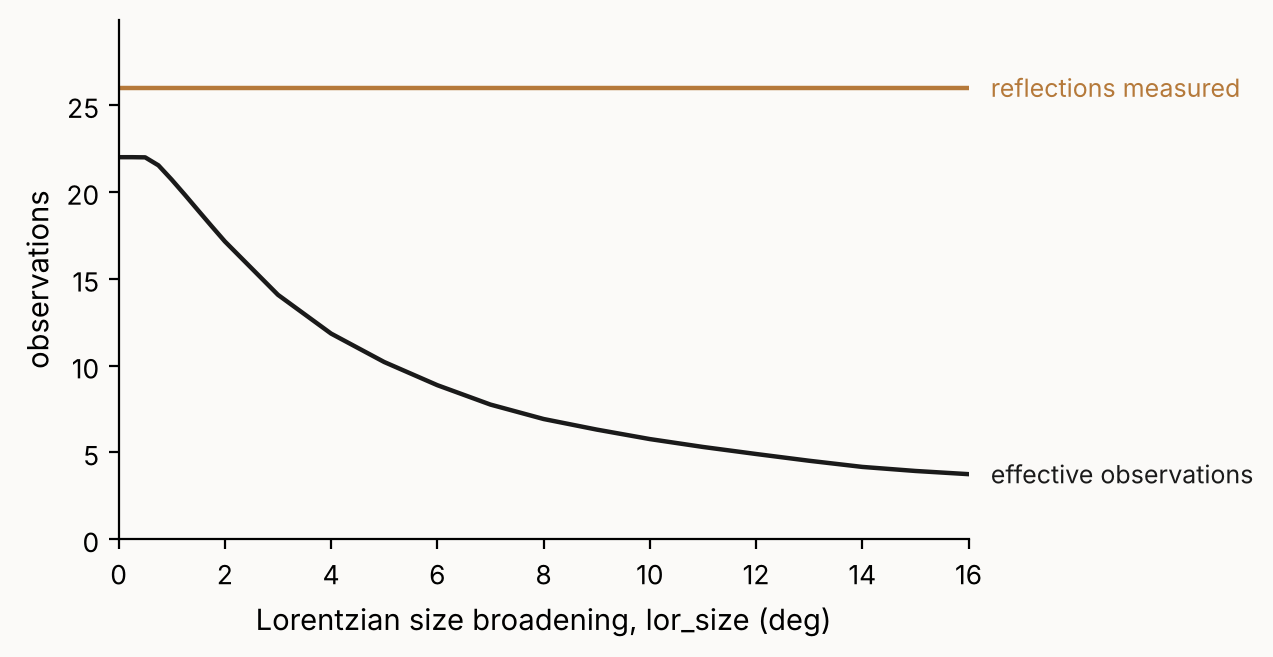
The figure is one Cu Kα LaB6 pattern over 15-140°.
The cell and the reflection list are held fixed, and the peaks are widened with Lorentzian size broadening alone, so the overlap is the only thing that moves.
There are 26 reflections throughout, and 22.0 effective observations while the lines are sharp, falling to 3.7 by the time the pattern is one hump.
The raw count cannot see any of that, so it is the wrong denominator for a parameter ratio.
The estimate is not a theorem.
The paper says so, and the IUCr guidelines repeat it: the approach “may not have a rigorous basis”.
What it gives is a reasonable estimate of how many parameters the data will support.
Each reflection is judged over ±2.0 FWHM, and the paper’s own check at ±4 FWHM lands 6.5 % lower on average, so the reported figure is a little generous.
Nothing here refuses anything.
The number is evidence, read beside the fit and never as a gate on it.
A ratio below 3.0 is a reason to hold parameters, and it does not mean the fit is wrong.
[Identifiability]() answers the sharper question of which parameter is unsupported.
A ratio below 5.0 raises [`DATA_SUPPORT_LOW`](diagnostics-refinement.html.md#data-support-low), as a warning below 3.0 and as information between the two.
## Identifiability
`RefinementResult.identifiability` is an `Identifiability` object.
It exists because these statistics cannot be recovered afterwards.
They are read off the final Jacobian, an N × P array that is never serialised, since a history node stores state and not curves.
So they are screened when the fit runs, or lost.
Rwp and the residual differ, because anyone can recompute them from the arrays already on the result.
| Field | Is | Reads as |
|---|---|---|
| `Identifiability.background_absorption` | dot-path → the block projection R² of that structural column onto the background column span | how much of a parameter the background could imitate; every screened path is listed, including those under the guard threshold, and these are the numbers the [`BACKGROUND_ABSORPTION`](diagnostics-refinement.html.md#background-absorption) diagnostic decided on |
| `Identifiability.extra_peak_absorption` | the same R², onto the span of the declared sharp peaks | how much of a parameter a declared peak could imitate; evidence only, with no threshold, and empty when no peak is declared or freed |
| `Identifiability.top_correlations` | the pairs with the largest \|ρ\|, each a `CorrelationPair`, worst first | which two refined parameters moved together |
| `Identifiability.soft_modes` | the softest directions of the scale-normalised normal matrix, each a `SoftMode` | the same problem where it involves three parameters or more, which no pairwise list can show |
| `Identifiability.exchangeability` | one `ExchangeRow` per held parameter screened | whether a parameter you held could have been absorbed by the ones you refined |
| Field | Is |
|---|---|
| `CorrelationPair.path_a`, `CorrelationPair.path_b` | the two dot-paths |
| `CorrelationPair.rho` | their signed correlation, from the final Jacobian the `HIGH_CORRELATION` check read, so the two always agree |
| `SoftMode.eigenvalue` | an eigenvalue of ĴᵀĴ with every column normalised to unit length, so it is dimensionless; for a single pair with correlation ρ it is 1 − \|ρ\|, and 0 is exact degeneracy |
| `SoftMode.loadings` | dot-path → component of the unit eigenvector, kept above 0.1 and signed so the largest is positive |
| `ExchangeRow.held` | the held parameter’s dot-path |
| `ExchangeRow.r2` | the block projection R² of its column onto the span of the free ones, evaluated at the converged values with the candidate freed on a copy of the vary set and never refined |
| `ExchangeRow.partners` | dot-path → signed loading of the reconstruction, kept above 0.05: which fitted values absorb the held parameter’s signature |
The two absorption tables partition the declared extra components by kind.
A hump is in the background span and a declared sharp peak in its own.
The softest modes are carried whatever their eigenvalues, because the number is the evidence and the report decides where comment starts.
Read `ExchangeRow.r2` alone with care.
It is a property of the design matrix over the sampled range, and it is high on clean fits too: 0.999945 on both a degenerate fixture and its clean reference.
The discriminating half, whether anything significant rides on the exchange, is in [the report](../concepts/report.html.md).
Its `ExchangeFinding` carries the fitted partner’s value and esd beside the same R².
`FitReport.identifiability` is a different type from this one.
The fields are empty when nothing was measurable: fewer than two free parameters, no Jacobian kept by the solver, or no pair or candidate to project.
`Identifiability.exchangeability` is also empty in Pawley mode.
`RefinementResult.identifiability` is `None` when nothing measured it, as on a replay of a history node, which solves nothing.
Read `None` as “not measured here”, never as “no degeneracy”.
A joint multi-histogram fit screens each histogram’s own rows.
Its `Identifiability.background_absorption` keys carry a `hist..` prefix, shared paths included, and `RefinementResult.for_histogram` hands one histogram’s view its own rows without the prefix.
A joint fit runs neither the declared-peak screen nor the parameter-space screens, so the other four fields stay empty there.
### Background component counts
The other half of “how flexible was the background” is a count.
`Identifiability.background_absorption` says what the background could imitate.
`RefinementResult.n_background_components` says with how many explicit humps it was allowed to do it.
N humps are 3N parameters with unconstrained positions, which a reader comparing two Rwp values has to be able to see.
[Extra components](instrument.html.md#extra-components) gives the fields of a hump.
There are two counts because there are two kinds of component.
`RefinementResult.n_extra_components` is the length of `Instrument.extra_components`: everything you declared, humps and declared sharp peaks alike.
`RefinementResult.n_background_components` is the humps alone.
A declared peak is freedom you granted, but it is not background freedom, and `Identifiability.background_absorption` excludes it for the same reason.
Declare no peaks and the two numbers are equal, which is every pattern written before v1.4.
Both counts sit on the result, because they are declared values and `Identifiability` holds measurements.
They are counted from what the compiled instrument carried, so they are there on a replayed node too, where `RefinementResult.identifiability` is `None`.
`0` means none was declared.
`None` means nothing was counted: a joint multi-histogram fit, which has one count per histogram, or a result recorded before the field existed.
## Restraint report
If the fit carried soft restraints, `RefinementResult.restraints` is a `RestraintReport`.
On a restrained refinement it is the first thing to read, before Rwp.
[How to restrain a bond length or an angle](../guides/restrain.html.md) declares restraints and schedules their weight.
| Field | Is | Reads as |
|---|---|---|
| `RestraintReport.rows` | one `RestraintRow` per restraint | the computed value against the target, below |
| `RestraintReport.restraint_chi2` | Σ weight·(deviation/σ)² | the penalty term SG of [(9.18)](../theory/parameterisation.html.md#equation-par-restraint-weight), at unit weight scale |
| `RestraintReport.weight_scale` | the cw the stage ran at | so the penalty the fit minimised is `RestraintReport.weight_scale` × `RestraintReport.restraint_chi2` |
| `RestraintReport.n_restraints` | how many rows there were | the rows are in the covariance but out of Rwp, so this is not part of N |
| Field | Is |
|---|---|
| `RestraintRow.kind` | `"bond"`, `"angle"`, `"value"`, `"tether"` or `"anti_bump"`; a tether is zero inside its maximum distance and an anti-bump zero beyond its minimum |
| `RestraintRow.phase_index` | which phase |
| `RestraintRow.atoms` | the atom indices a distance or angle restraint names, two or three of them; `None` for a value restraint |
| `RestraintRow.path` | the dot-path a value restraint names; `None` otherwise |
| `RestraintRow.computed`, `RestraintRow.target` | the value at the answer and the declared target, in Å for a distance, degrees for an angle, or the parameter’s own units |
| `RestraintRow.deviation` | computed − target |
| `RestraintRow.sigma`, `RestraintRow.weight` | the σ and the weight you declared |
| `RestraintRow.deviation_over_sigma` | the deviation in units of that σ |
The deviations are always reported unscaled.
“Is this restraint satisfied?” is a question about the geometry, and cw is a choice about how hard to insist on the answer.
A row past three σ raises [`RESTRAINT_TENSION`](diagnostics-refinement.html.md#restraint-tension).
The restraint and the data are then pulling against each other, and one of them is wrong.
A joint fit reports the same object per histogram, on `HistogramResult.restraints`.
## Absorption correction
Specimen absorption has three geometries behind one record, and one of them provably cannot move Rwp.
The capillary factor is exactly a constant times exp(c·sin²θ), so applying it is an exact reparameterisation of the phase scale and the displacement parameters.
A comparison of fits would show nothing.
`RefinementResult.absorption` is an `AbsorptionCorrection` record, and it says what the correction changed.
It is present only for a Rietveld fit that carried a specimen dimension, and `None` otherwise.
A fit that declared no dimension is not the same as a specimen of no thickness.
[Absorption](instrument.html.md#absorption) covers declaring one, and [Capillary (cylindrical) absorption](../theory/corrections.html.md#capillary-cylindrical-absorption) and [Flat-plate absorption](../theory/corrections.html.md#flat-plate-absorption) give the expressions.
| Field | Is | Reads as |
|---|---|---|
| `AbsorptionCorrection.method` | `"rouse_cylinder"`, `"flat_plate_reflection"` or `"flat_plate_transmission"` | which geometry’s expression ran |
| `AbsorptionCorrection.mu_r` | the dimensionless µ·(length) | the capillary radius for the cylinder, the specimen thickness for the two plates |
| `AbsorptionCorrection.mu_r_source` | `"given"` or `"estimated"` | estimated means composition × packing × that length, so it inherits their uncertainty |
| `AbsorptionCorrection.wavelength` | the λ it was computed at | µ depends on wavelength, so the number does not carry between sources |
| `AbsorptionCorrection.equivalent_delta_biso` | the Biso bias, in Ų, that refining without this correction would have absorbed | positive means add this to recover the unbiased value; for the cylinder this is the entire content of the correction |
| `AbsorptionCorrection.unabsorbed_fraction` | the share of ln A that a free scale and a free Biso cannot reproduce | zero for the cylinder to rounding, a few to tens of per cent for a plate, and so how far to trust the ΔBiso above; `None` for the cylinder |
| `AbsorptionCorrection.identifiable_fraction` | the same measure applied to ∂lnA/∂µt | the number behind the decision not to make the thickness refinable; `None` for the cylinder |
| `AbsorptionCorrection.intensity_fraction_of_optimal` | µt·exp(1 − µt), transmission only | the counts this specimen delivered as a fraction of the best it could have; a badly chosen thickness costs counting statistics and leaves the accuracy alone, so no fit statistic shows it |
| `AbsorptionCorrection.out_of_range` | whether µR left the Rouse expression’s validated range | the value was still used, because refusing it would drop real absorption; never set for a plate, whose expressions are exact integrals |
| `AbsorptionCorrection.skipped` | why no correction ran, or `None` | the product was asked for and could not be estimated, so the correction was not applied |
The flat-plate correction is not an exact reparameterisation.
That makes its `AbsorptionCorrection.equivalent_delta_biso` a lower bound.
The projection behind it is unweighted, while a refinement finds a weighted compromise.
Measured against synthetic refits, the bias a fit absorbs runs 1.06 to 1.5 times the predicted one, tracking `AbsorptionCorrection.unabsorbed_fraction`.
## Diagnostics
`RefinementResult.diagnostics` carries the findings that say an answer is wrong although Rwp is fine.
Each entry is a `Diagnostic`:
| Field | Is |
|---|---|
| `Diagnostic.code` | the code, such as `HIGH_CORRELATION` |
| `Diagnostic.level` | `"info"`, `"warning"` or `"error"` |
| `Diagnostic.message` | what this case found, with its numbers |
| `Diagnostic.suggestion` | what to do |
| `Diagnostic.where` | the parameter paths involved |
| `Diagnostic.value` | the headline number where the code has one, such as a correlation’s ρ or an absorption’s block R²; `None` means no single number, not zero |
| `Diagnostic.explanation` | what the code means and why it fires |
`Diagnostic.explanation` is the same for every finding with that code, so it is looked up in `rietx.help.DIAGNOSTIC_HELP` when read.
It is `None` for a code this version does not describe.
[Diagnostic codes](diagnostics.html.md) lists every code.
The codes are an open vocabulary on purpose, so a new correction ships with the diagnostic that states what it changed.
Read them before the statistics, every time.
A pair that stays correlated through a plan’s stages gives one `HIGH_CORRELATION` finding, with the worst |ρ| kept and every stage it fired in named in the message.
`FLAT_DIRECTION` is merged across stages the same way.
`RefinementResult.diagnostics` keeps every finding.
A printed result shows at most ten `HIGH_CORRELATION` rows, worst first, and at most ten `FLAT_DIRECTION` rows.
Past each cap a `HIGH_CORRELATION_OMITTED` or `FLAT_DIRECTION_OMITTED` row gives the omitted count and points at `RefinementResult.identifiability` for the rest.
## Printing a result
`print(result)`, which is `str(result)`, is the view a bare `RefinementResult` can answer on its own.
It shows each stage’s status, the last stage’s convergence number (max|Δθ|/esd), every diagnostic, the provenance, and the agreement indices last.
It is given no deliverable, so an error prints in full and every other diagnostic on one line, its code, its paths and the purposes it is a warning under.
`RefinementResult.summary(deliverable="qpa")` prints the same view with the diagnostics read under that purpose: the errors and the warnings for it in full, the rest one line each.
It adds nothing else, and its last diagnostic line names `Refinement.summary`, which prints the rows that decide the purpose.
Both need no compiled model, so they work on a result read back from a project or handed across a process boundary.
Every `summary()` also takes `levels=`, a map from a code to `"allow"`, `"warn"` or `"deny"`.
The caller’s word replaces the audited level under every purpose, so an expert can quiet a code and a pipeline can print one as an error.
It never lowers a diagnostic raised as an error, and the diagnostics header counts the rows it set.
`RefinementResult.usable_under({"PATTERN_UNDERSAMPLED": "deny"})` is `usable` under the same map, so a pipeline can treat a code as blocking.
`usable` itself reads nothing but the stored result, so it answers the same on every machine.
It stays under 80 lines on a five-stage fit.
[A first fit in Python](../start/first-fit.html.md) shows one.
`Refinement.summary()`, called after `Refinement.fit` on the session that ran it, prints more, because a session holds the compiled model.
It shows the same stage and diagnostic rows, then the report’s misfit summary: the worst regions by χ² share, the unmatched-peak count, and the serial correlation as Durbin-Watson with the esd inflation it causes.
Then come the next parameter to free, and the protocol run: the plan, every held path grouped by why, the excluded ranges, N points against N reflections and the σ source.
The agreement indices come last, with a named visual check:
```python
print(ref.summary())
```
The `next:` line is a `Refinement.suggest` probe on the channels the fit ran on.
It is read as ΔBIC rather than as the Δχ² that ranks the candidates.
It costs one Jacobian build and no solve.
The fluorapatite tutorial fit under `mccusker_structural` prints:
```text
next: free phases.0.atoms.2.occ, predicted ΔBIC +33.0 at N_eff 1242 (Δχ² 464)
```
`N_eff` is the count the ΔBIC was charged at, the channel count over the squared Bérar-Lelann factor, and not the raw channel count.
When ΔBIC refuses the leading candidate, the line says so, as `next: leads on Δχ² … and ΔBIC refuses it`, and names a lower-ranked candidate ΔBIC does admit if there is one.
When no held parameter clears the noise floor, it reads `next: nothing to free`.
[How to choose the next parameter to free](../guides/next.html.md) works with the full ranking.
`deliverable=` adds the rows one purpose decides on, because the report will not infer your purpose.
It also decides which diagnostics print in full: the errors and the warnings for that purpose, with every other row on one line.
`"phase_id"` adds the unmatched observed peaks and the Le Bail gap ratio.
`"qpa"` adds the worst entry of `background.absorption` and the weight fractions with esds.
`"structure"` adds `identifiability.exchangeability`.
`"cell"` adds each phase’s refined cell with its esds and volume, then the rows of `identifiability.exchangeability` that name a cell path.
`"microstructure"` adds each phase’s `result.microstructure` readings, or says the size and strain are not quotable when `RESOLUTION_UNCONSTRAINED` fired.
`"calibration"` adds the instrument parameters the fit refined, and whether the standard’s cell was held fixed, as a calibration needs.
`"magnetic"` adds each site’s moment rows and the moment directions the stages held or turned (`StageResult.moment_flat_axes`, `StageResult.moment_turned`).
[How to find the weight fraction of each phase in a mixture](../guides/qpa.html.md) and [Structure agreement indices]() say what each row means:
```python
print(ref.summary(deliverable="qpa"))
```
A figure takes a title only when you ask for one.
`RefinementResult.plot` (`rietx.viz.plots.plot_result`), `PatternData.plot` and `SeriesResult.plot` (`rietx.viz.plots.plot_trajectory`) accept `title=`, which draws your words above the figure in the panel’s own type.
Without it no title is drawn.
For a paper the caption is the title, and the fit statistics stay a corner annotation either way.
A notebook cell or a batch of thirty patterns has no caption, and that is where the keyword belongs:
```python
result.plot(path="p03.png", title="pattern 3 of 30, 250 °C")
```
`plot_for_vlm` refuses `title=` by name.
Its panel titles are the evidence the vision model reads, and a title prefixed to them would push those numbers further along the line.
`plot=` writes `plot_for_vlm` to that path and names it on the last line.
It draws the regions the text names, with their numbers in the panel titles, so the picture confirms the text rather than standing in for it:
```python
print(ref.summary(plot="fit.png"))
```
`report=` takes the `FitReport` that `Refinement.report` already built, so you get the text and the structured report from one report build instead of two.
The report is the slow half of the call, and in a batch building it twice dominates the time.
Pass the report or `plan=`.
A report was built under its own plan, so the call raises `ValueError` when given both.
```python
report = ref.report()
print(ref.summary(deliverable="qpa", report=report))
```
A series prints its own view.
`SeriesResult.summary()`, which is `str(series_result)`, shows the `SEQUENTIAL_*` series diagnostics, then the trajectory: each shown pattern’s label, x, status and Rwp, the first and last five with the count between them.
`parametric=` takes a joint fit of the same patterns with parametric declarations and prints its coefficients after the trajectory.
[How to fit a temperature series](../guides/series.html.md) says what the series diagnostics mean.
The fourth deliverable is the series’ own, because no single pattern carries a `SEQUENTIAL_*` row.
`series.summary(deliverable="series")` adds the rows that decide a parameter measured against the series axis.
They say whether the ordering was checked at all (`direction="both"`, or a plain statement that it was not), and list the persistent findings.
They give each step with what an independent cold pair reproduced, and the phases held for want of support.
They also ask for the two things no diagnostic can supply: a stated 2θ-scale anchor and the split between precision and accuracy.
The other three purposes are refused there by name, and `Refinement.summary(deliverable="series")` answers with where the series rows live:
```python
print(series.summary(deliverable="series"))
```
## Diagnostics over a batch
A batch of fits is read as counts rather than row by row.
`diagnostics_summary(results)` takes a list of `RefinementResult`s and returns a `DiagnosticsSummary`.
Every level it counts comes from the view `summary()` prints.
So a count never disagrees with a printed row.
`deliverable=` and `levels=` mean what they mean to `summary()`.
An unknown deliverable, code or level word is refused the same way, even on an empty list.
| Field | Is |
|---|---|
| `DiagnosticsSummary.n_results` | the number of results in the batch |
| `DiagnosticsSummary.deliverable` | the deliverable the counts were taken under, or `None` |
| `DiagnosticsSummary.levels` | the caller’s `levels=` map, empty when none was given |
| `DiagnosticsSummary.codes` | one `CodeTally` per code that fired, most results first |
| `DiagnosticsSummary.warnings_per_result` | the mean number of warning rows a result carries, keyed by purpose |
| `DiagnosticsSummary.pareto` | one `ParetoRow` per code with a warning row, largest share first |
A `CodeTally` counts one code, named by `CodeTally.code`.
`CodeTally.n_results` is the number of results it fired on.
`CodeTally.rate` is that number over the batch.
`CodeTally.n_rows` counts all its rows.
`CodeTally.n_error`, `CodeTally.n_warning` and `CodeTally.n_info` split those rows by level.
Under a deliverable, a row’s level is its level for that purpose.
Without one, a row’s level is the level it was raised at.
`DiagnosticsSummary.pareto` is the “bad actor” ranking of alarm management (ISA-18.2).
`ParetoRow.code` names the code.
`ParetoRow.n_warning` counts its warning rows.
`ParetoRow.share` is that count over every warning row in the batch.
`ParetoRow.cumulative` adds the shares down the ranking, so the last row reads 1.0.
A code that fired only as `info` or `error` is in `codes` and not in `pareto`.
Without a deliverable, `warnings_per_result` has a key for every purpose except `"series"`.
Each value is counted under that purpose.
With a deliverable, it has that key alone.
An empty list gives `n_results` 0 and empty tallies:
```python
summary = rx.diagnostics_summary(results, deliverable="qpa")
print(summary)
```
`print(summary)` shows the Pareto table.
Each row gives the code, the results it fired on, its warning rows and the cumulative share.
The counts decide nothing.
A code that fires on most of a batch says something the fits share, such as the model or the plan.
## Objects in a notebook or a terminal
Every rietx object prints as text you can read, and a notebook cell shows the same text.
A model prints as an indented tree with one line per parameter: its value with the esd in brackets, its unit, and `(vary)` when it is free.
The one-line fields of a block print their values in one column.
Fields that are `None` or empty are left out.
A long sequence prints as a count and a range, in `repr` and in `print` alike, so a pattern never prints its channels:
```python
from rietx import PatternData
data = PatternData(two_theta=[10.0 + 0.02 * i for i in range(500)],
intensity=[100.0 + i for i in range(500)])
print(data)
```
```text
PatternData of 500 points, 10–19.98° 2θ, median step 0.02°
intensity: <500 floats 100…599>
sigma: None
excluded_regions: none
metadata: none
```
The numbers are still there.
`PatternData.tt`, `PatternData.y` and `RefinementResult.y_calc` are the arrays.
These objects print a view of their own:
| Object | Prints |
|---|---|
| `PatternData` | the range and step, then whether σ came with the file |
| `PatternDiagnostics` | every field under three headings, each number to three significant figures; an empty finding as `none`, and a check that could not run as `not checked` |
| `RefinementResult` | the termination view in [Printing a result]() |
| `RefinedParameter`, `ParameterRow` | `path value(esd) state` on one line, so `ref.parameters()` reads as a table |
| `Diagnostic` | `level[CODE]: message`, then `at:` with the paths and `help:` with the suggestion |
| `GeometryDistance` | the pair, the distance with its esd and the image’s symmetry code, on one line |
| `PhaseMicrostructure` | one row per term, each reading with its esd or the reason it is missing |
| `FitReport` | Rwp and the goodness of fit, the summary one sentence a line, then each active suggestion |
| `Refinement` | its phases, mode, last fit, history and the parameters that vary |
| `RefinementTree` | `RefinementTree.summary`, the tree with Rwp on each node |
| `IndexingResult` | what `rietx index` prints: the candidates, the verdict, every diagnostic |
| `PeakList` | one row per peak, between a count line and every diagnostic |
| `SeriesResult` | `SeriesResult.summary` |
| `Trajectory` | one row per point: its label, its x and its value with the esd |
A `Refinement` reads only its own fields when it prints.
It never calls `Refinement.summary`, which builds a report.
A notebook asks for the text each time a cell displays the refinement.
In a notebook, a `RefinementResult`, an `IndexingResult` and a `PeakList` add to their text.
Under each diagnostic’s `help:` line, a `means:` line gives its `Diagnostic.explanation`.
A result then lists `RefinementResult.parameters` in columns headed `path`, `value` and `at_bound`.
An `equations` column follows when a parametric equation set a row.
The display is one block of fixed-width text, so its columns stay aligned in GitHub’s notebook viewer as well as in JupyterLab.
A `StructureFigure` from `render_structure` displays as its picture.
A figure behaves in a notebook as any returned value does.
A bare `result.plot()` shows the figure once.
A trailing `;`, or `fig = result.plot()`, shows nothing, and `fig` on its own line shows it.
rietx leaves the notebook’s plotting backend alone, so `plt.show()` keeps working afterwards.
A script, the command line and the GUI draw on matplotlib’s non-interactive `Agg` canvas.
A notebook stores every figure it shows, so a figure in a cell is encoded for a screen.
It is a PNG at twice a 100-dpi screen, sharp on a high-density display, drawn at its designed width, with a 256-colour palette.
The fluorapatite fit figure takes 52 kB this way against 194 kB at its own 300 dpi, with 98.84 % of its pixels unchanged and the rest edge pixels within 31/255 of their original value.
A figure drawn in the light palette also carries its dark form, and the notebook’s theme picks which one shows.
A file written with `path=` or `fig.savefig()` keeps the figure’s own dpi and full colour, and a figure you draw yourself is encoded as matplotlib encodes it.
## Progress lines
`progress=` writes one line per stage boundary to a text stream or a path.
`Refinement.fit`, `MultiHistogramRefinement.fit`, `refine_multi`, `SequentialRefinement.fit` and `refine_sequential` take it.
Under a series each line is stamped with the pattern’s place in it.
A path is opened for appending.
```python
result = ref.fit(data, progress=sys.stdout)
# stage scale_bkg converged Rwp 0.5704 0s
# stage zero converged Rwp 0.4556 0s
# ...
```
```python
series = rx.refine_sequential(patterns, structure, instrument,
labels=["250C", "300C"], progress="run.log")
# [series 1/2] 250C stage scale_bkg converged Rwp 0.0812 3s
# [series 2/2] 300C stage warm_refit converged Rwp 0.0805 1s
```
Each line gives the stage name, its status, its Rwp and its wall-clock time in whole seconds.
The time covers the whole named stage, including the second solve of a stage that releases a phase.
`progress=` is an `events=` subscriber and not a second telemetry channel.
Every number on the line is read off the event `rietx watch` tails, so the two always agree about what happened.
Pass both: `progress=` adds a subscriber, and keeps a callback or path already given as `events=`.
[How to watch or stop a running fit](../guides/watch.html.md) reads the same events.