The GUI: a first fit
rietx gui is a browser front end for everything the rest of Part 1 describes.
It runs a small HTTP server on your own machine, serves one page to a browser,
and calls the same Refinement methods a script would. Nothing about a project
is private to it: a project the GUI made opens in Python, and a fit run from a
script shows up in the GUI’s history.
This chapter gets you from an empty screen to a fit you have read. The GUI panel by panel then goes panel by panel, and The GUI as a text document and a wire is the text document, the keyboard and the wire.
For agents
This chapter is for a person at a screen. Driving rietx from a program is Calling rietx from a program, and the operating protocol is the agent skill. The GUI’s routes are listed in The GUI as a text document and a wire, but they are declared provisional and the Python API is the one to build on.
Install and start
The GUI needs the gui extra, which is plotly and nothing else. The front end
itself is committed inside the package, so installing it never needs node.
$ pip install 'rietx[gui]'
$ rietx gui
rietx gui — http://127.0.0.1:8731/
  no project — open or create one in the app
  Ctrl-C to stop
A browser opens on that address. --no-open suppresses that, --port moves it,
and rietx gui my_sample.rex starts with a project already open. The command line has
every option.
Everything you do writes to the project as you do it. There is no unsaved state
and no “are you sure?” on close, because each verb persists as it runs. That
also means there is no read-only way to look at a project: opening one appends a
line to its log before you have clicked anything. To look without changing, use
rietx gui my_sample.rex --scratch, which works on a byte-for-byte copy in a
temporary directory.
Start with an example
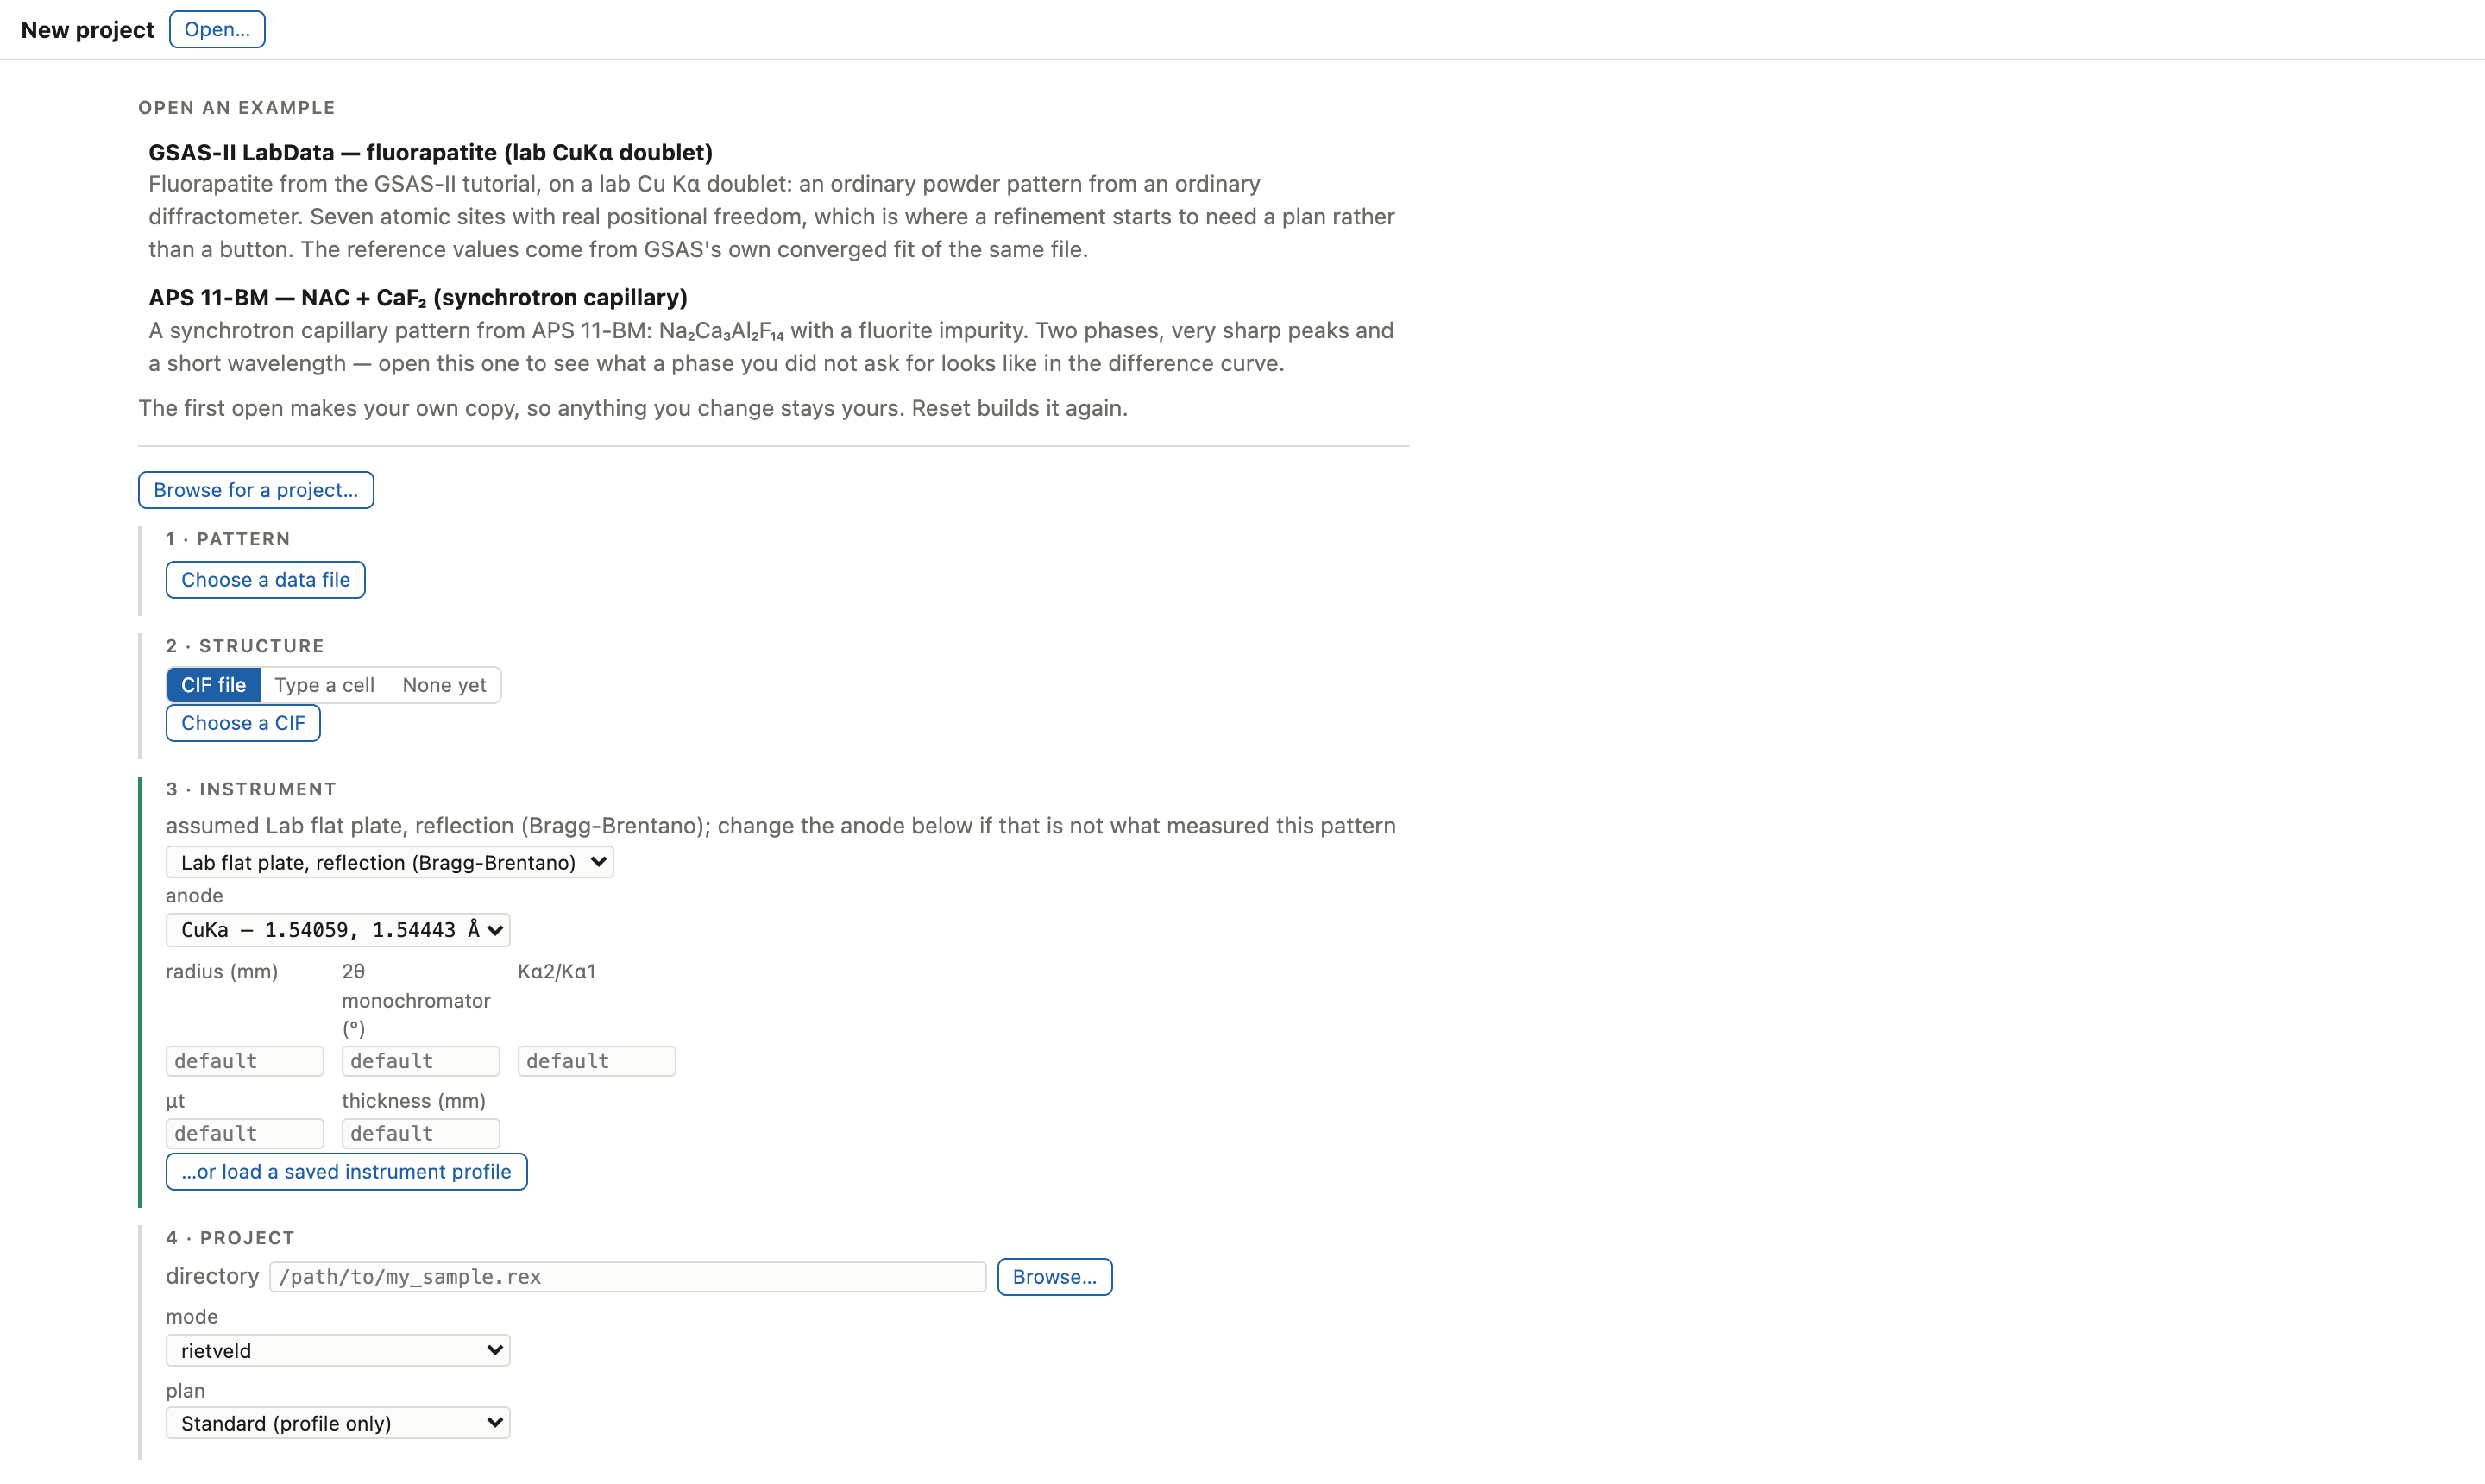
With no project open, the screen is the import panel, and it offers three ways
in: a list of projects you opened recently, a Browse for a project… button,
and a list of example projects shipped inside the package. Start from an example
if you have no data of your own.
The package ships 2 of them. Each is a real specimen with a
published reference value, and each carries the refinement protocol its
acceptance suite measures, so a fit of one is comparable with a number somebody
else recorded. Opening one makes your own copy, so anything you change stays
yours; a Reset button beside an example you have already opened throws that
copy away and builds it again.
Open the fluorapatite example. It is an ordinary laboratory pattern from an ordinary diffractometer, with seven atomic sites. That is the point at which a refinement starts to need a plan rather than a button.
What is on the screen
The window is two columns. On the left is the pattern; on the right is a column of nine tabs, all mounted at once:
Tab |
Is |
|---|---|
|
every parameter, with the one control that frees it |
|
the stages the fit will run, and what each one frees |
|
picked lines, and indexing a pattern that has no structure yet |
|
the structure and the instrument, and a 3D view of the cell |
|
the whole project as one editable text document |
|
many patterns refined as a chain |
|
what the package will say about the fit it just ran |
|
every state the refinement has passed through |
|
what this build of the package can do |
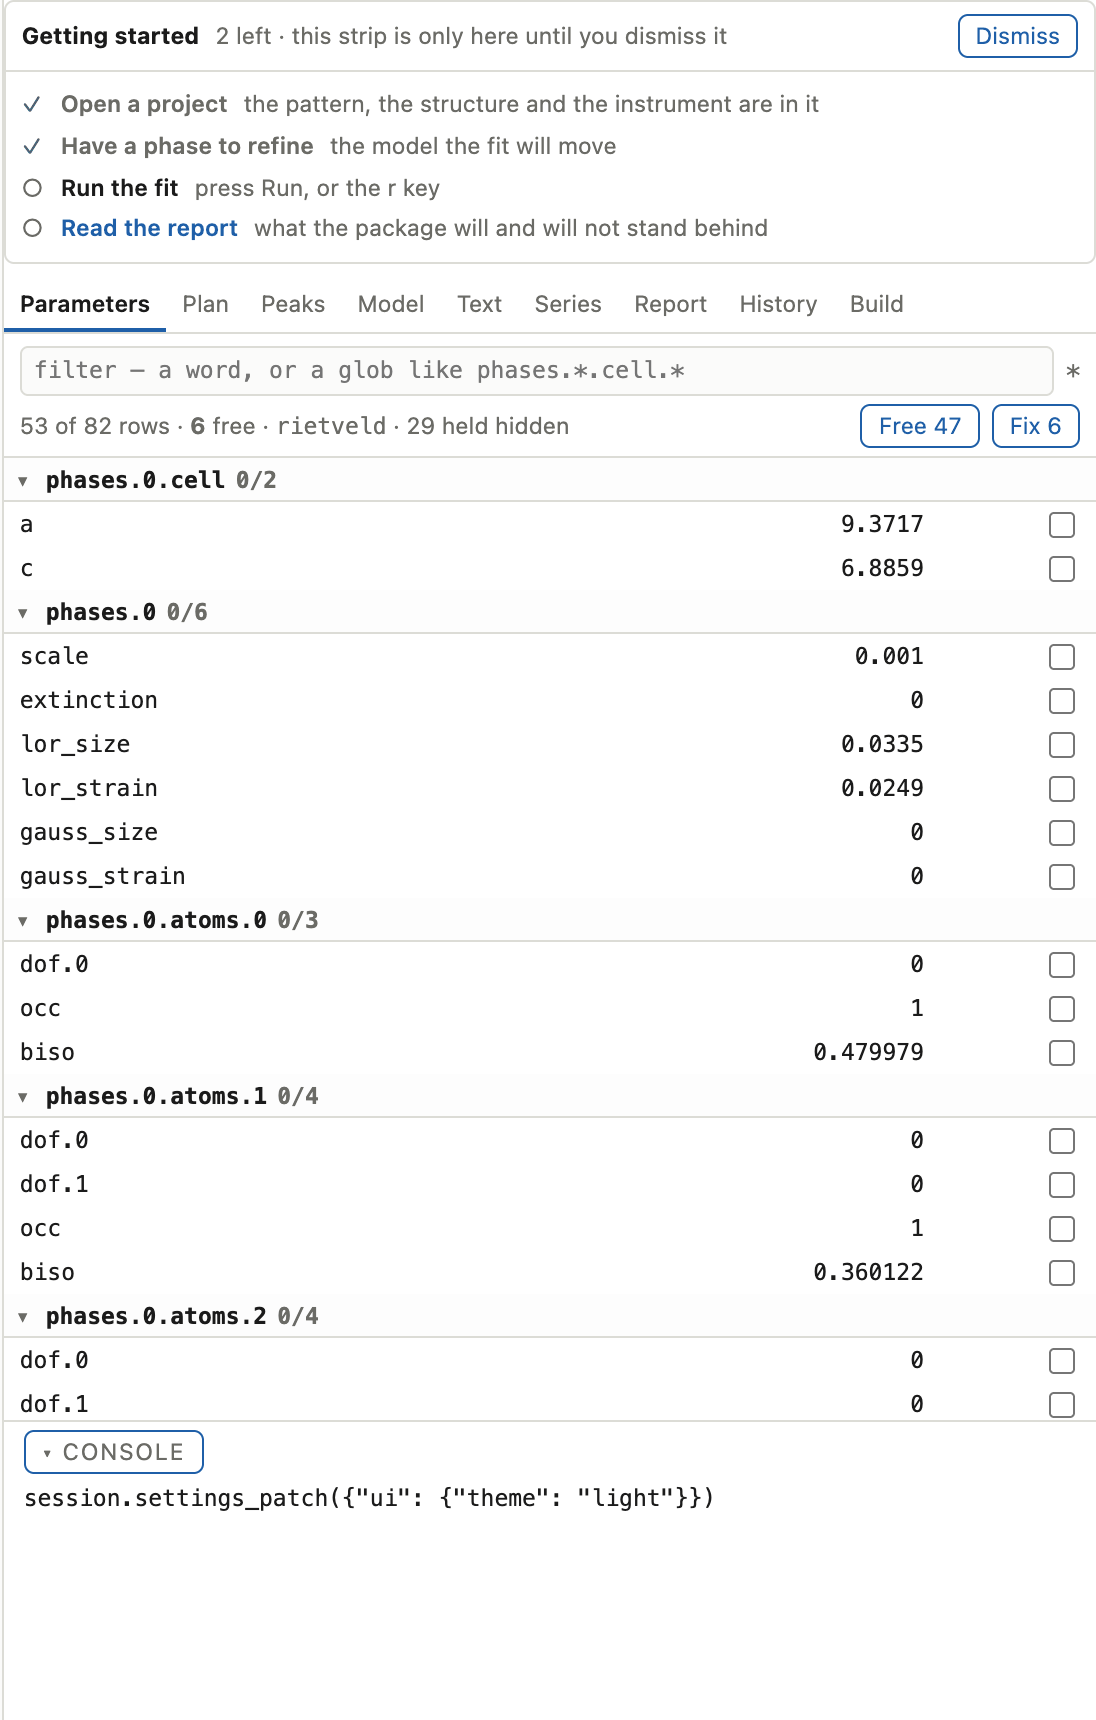
On a project’s first open a Getting started strip sits above the tabs. It is
four steps, and it is neither a wizard nor modal. You can ignore it, work around
it, and dismiss it whenever you like. Every step except the last is derived from
the project rather than remembered, so it cannot disagree with what you have
actually done: undo a fit and Run the fit un-ticks itself.
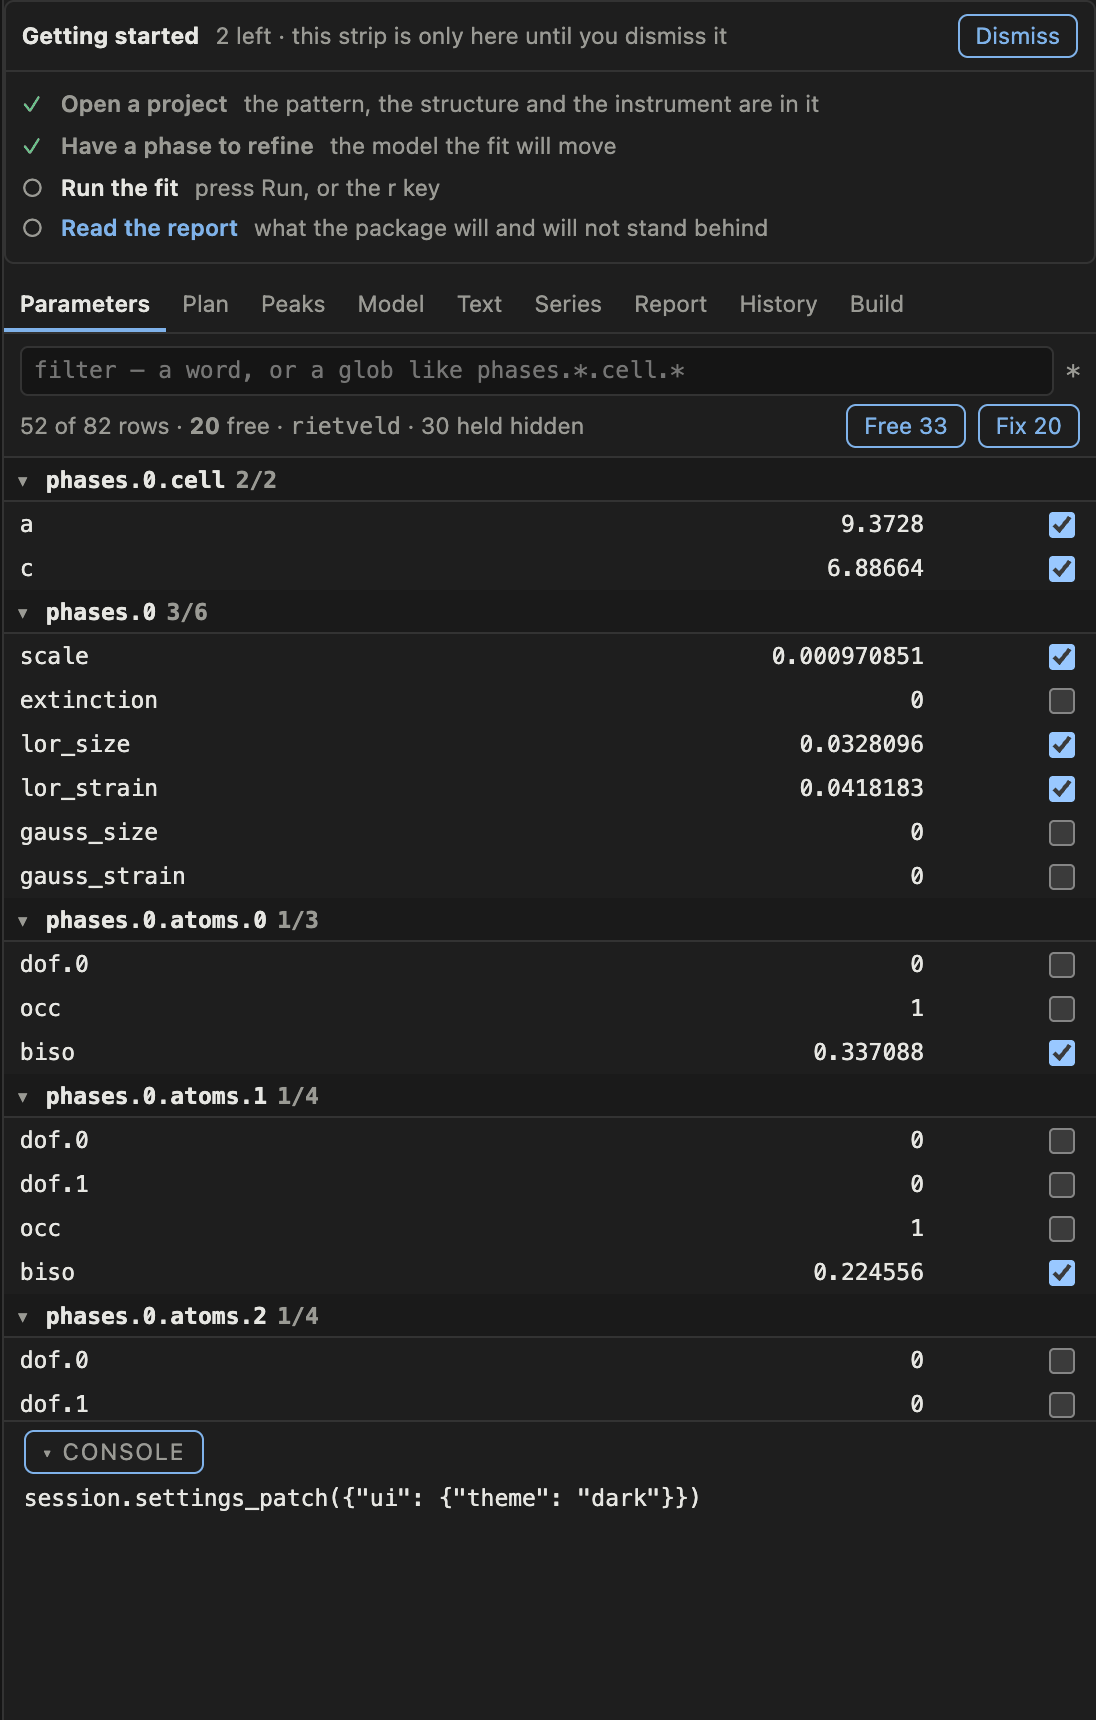
Dismissing it is remembered for that project, and nothing else about it is written.
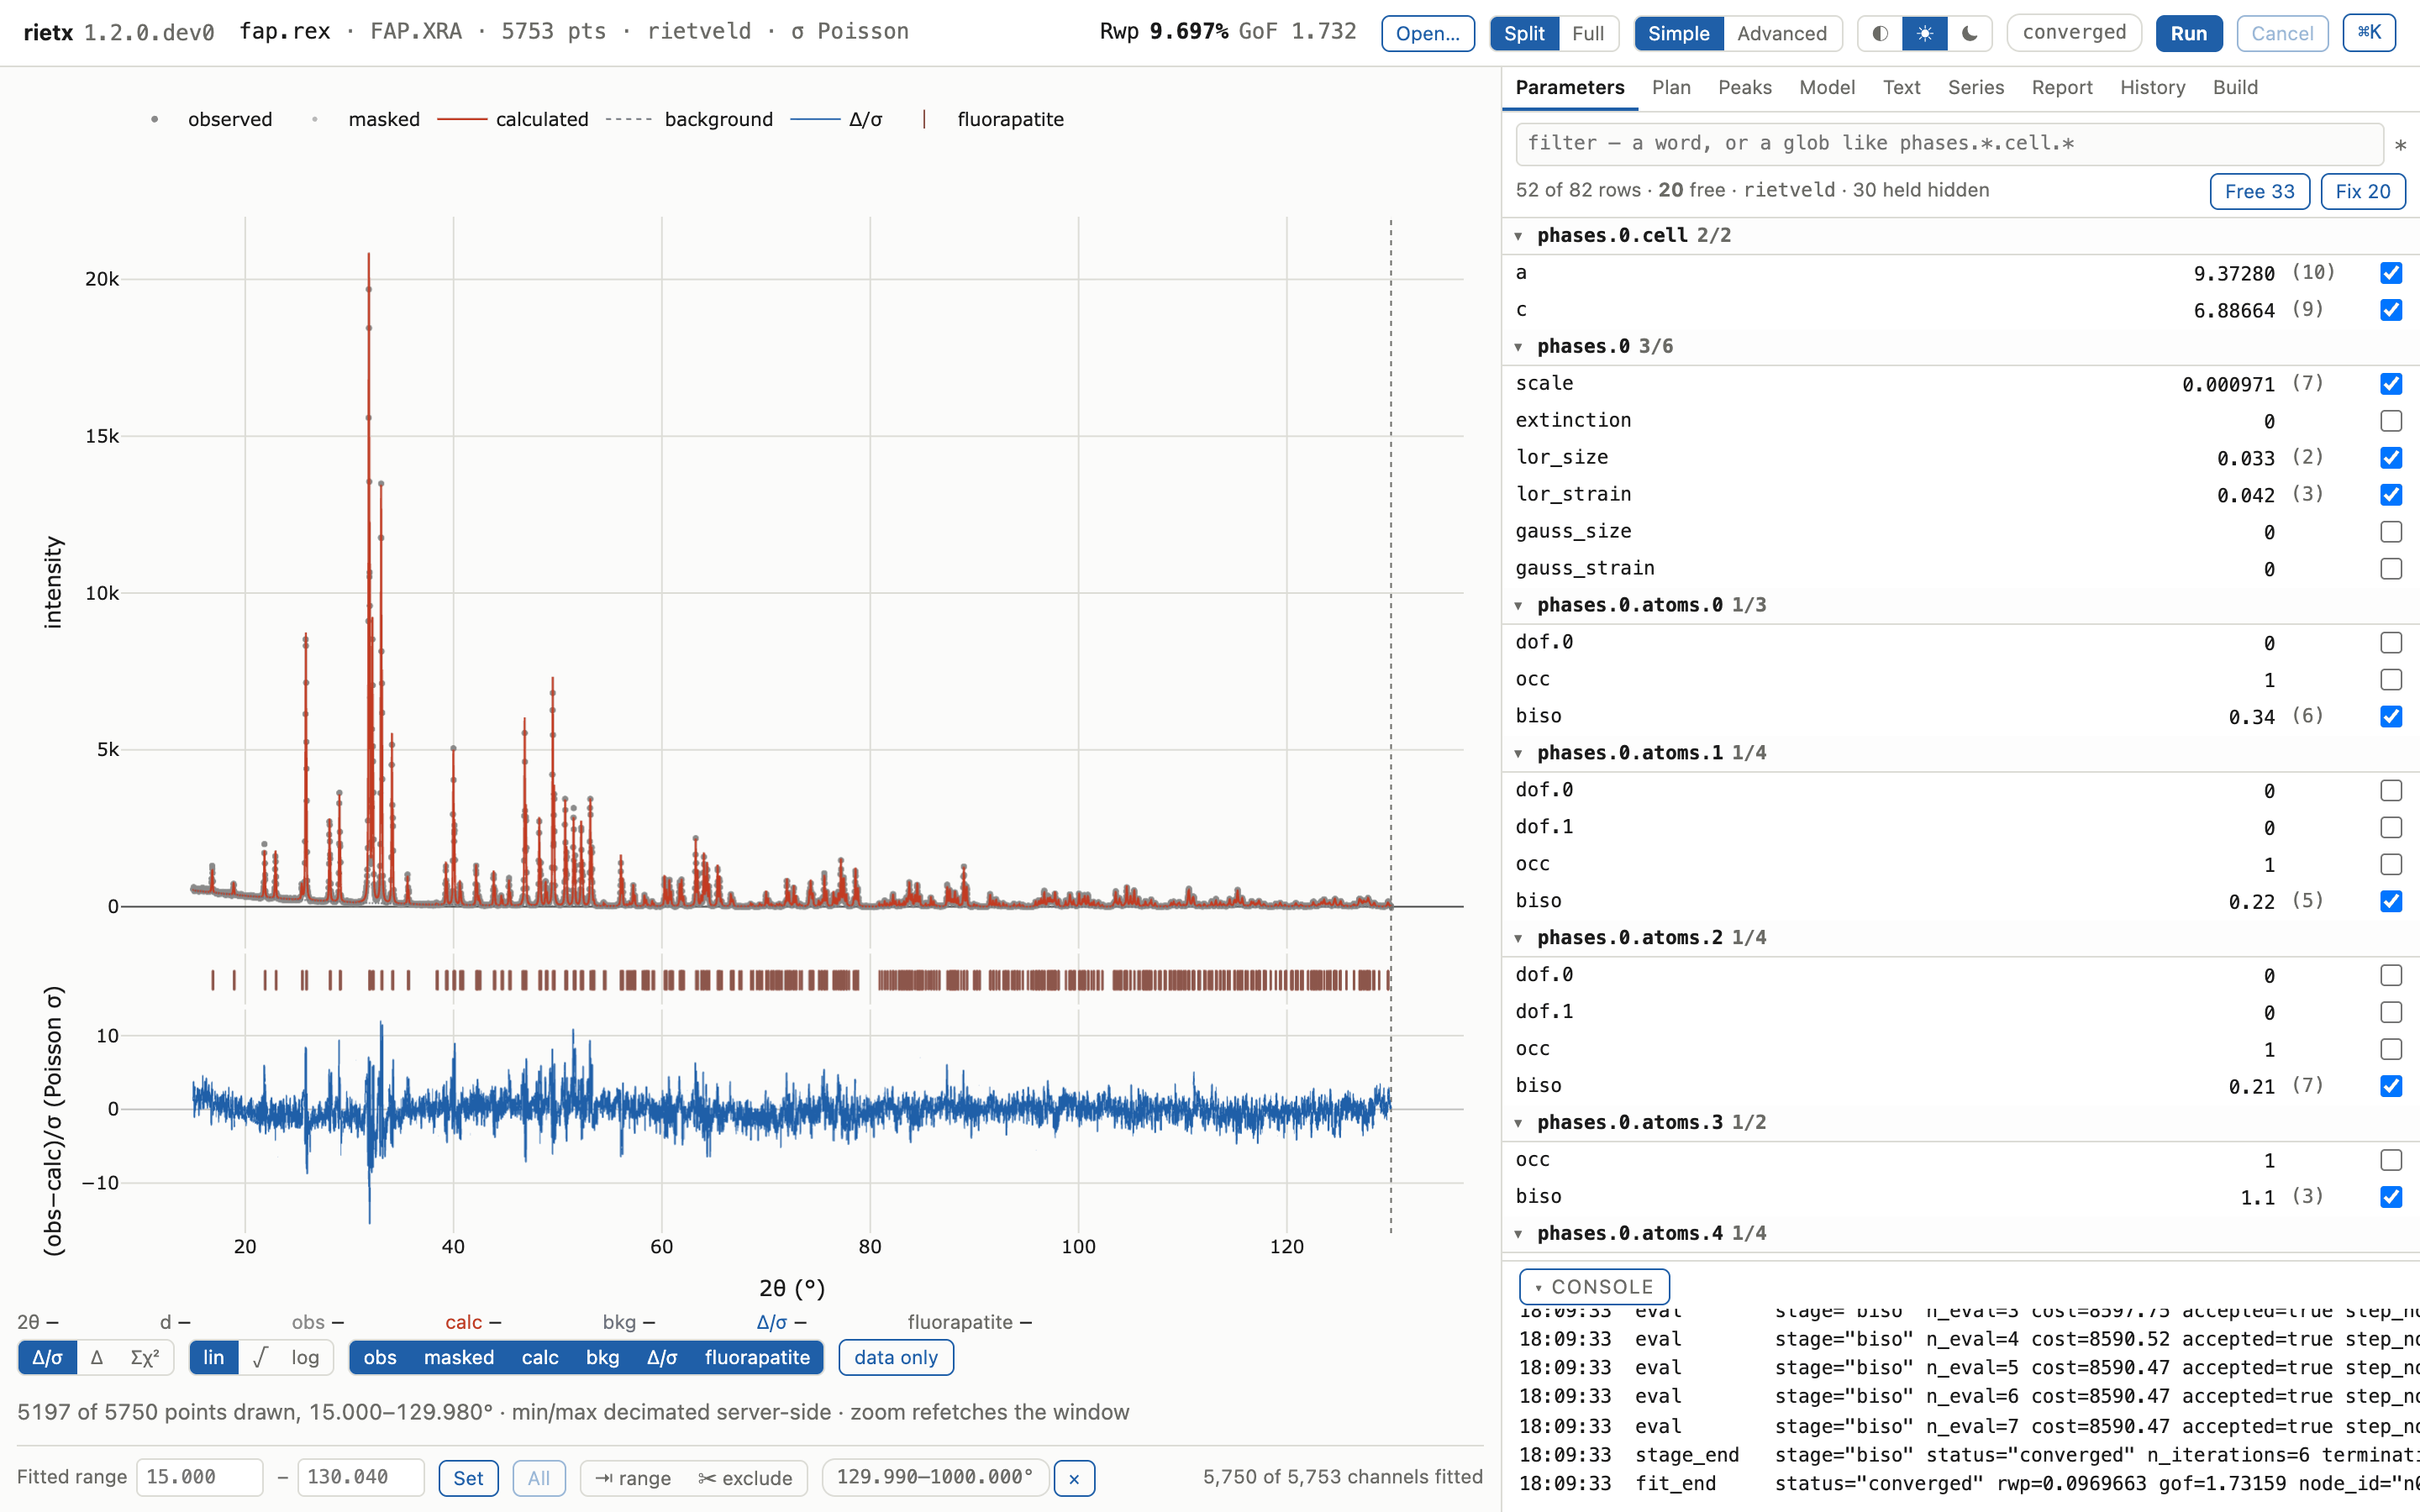
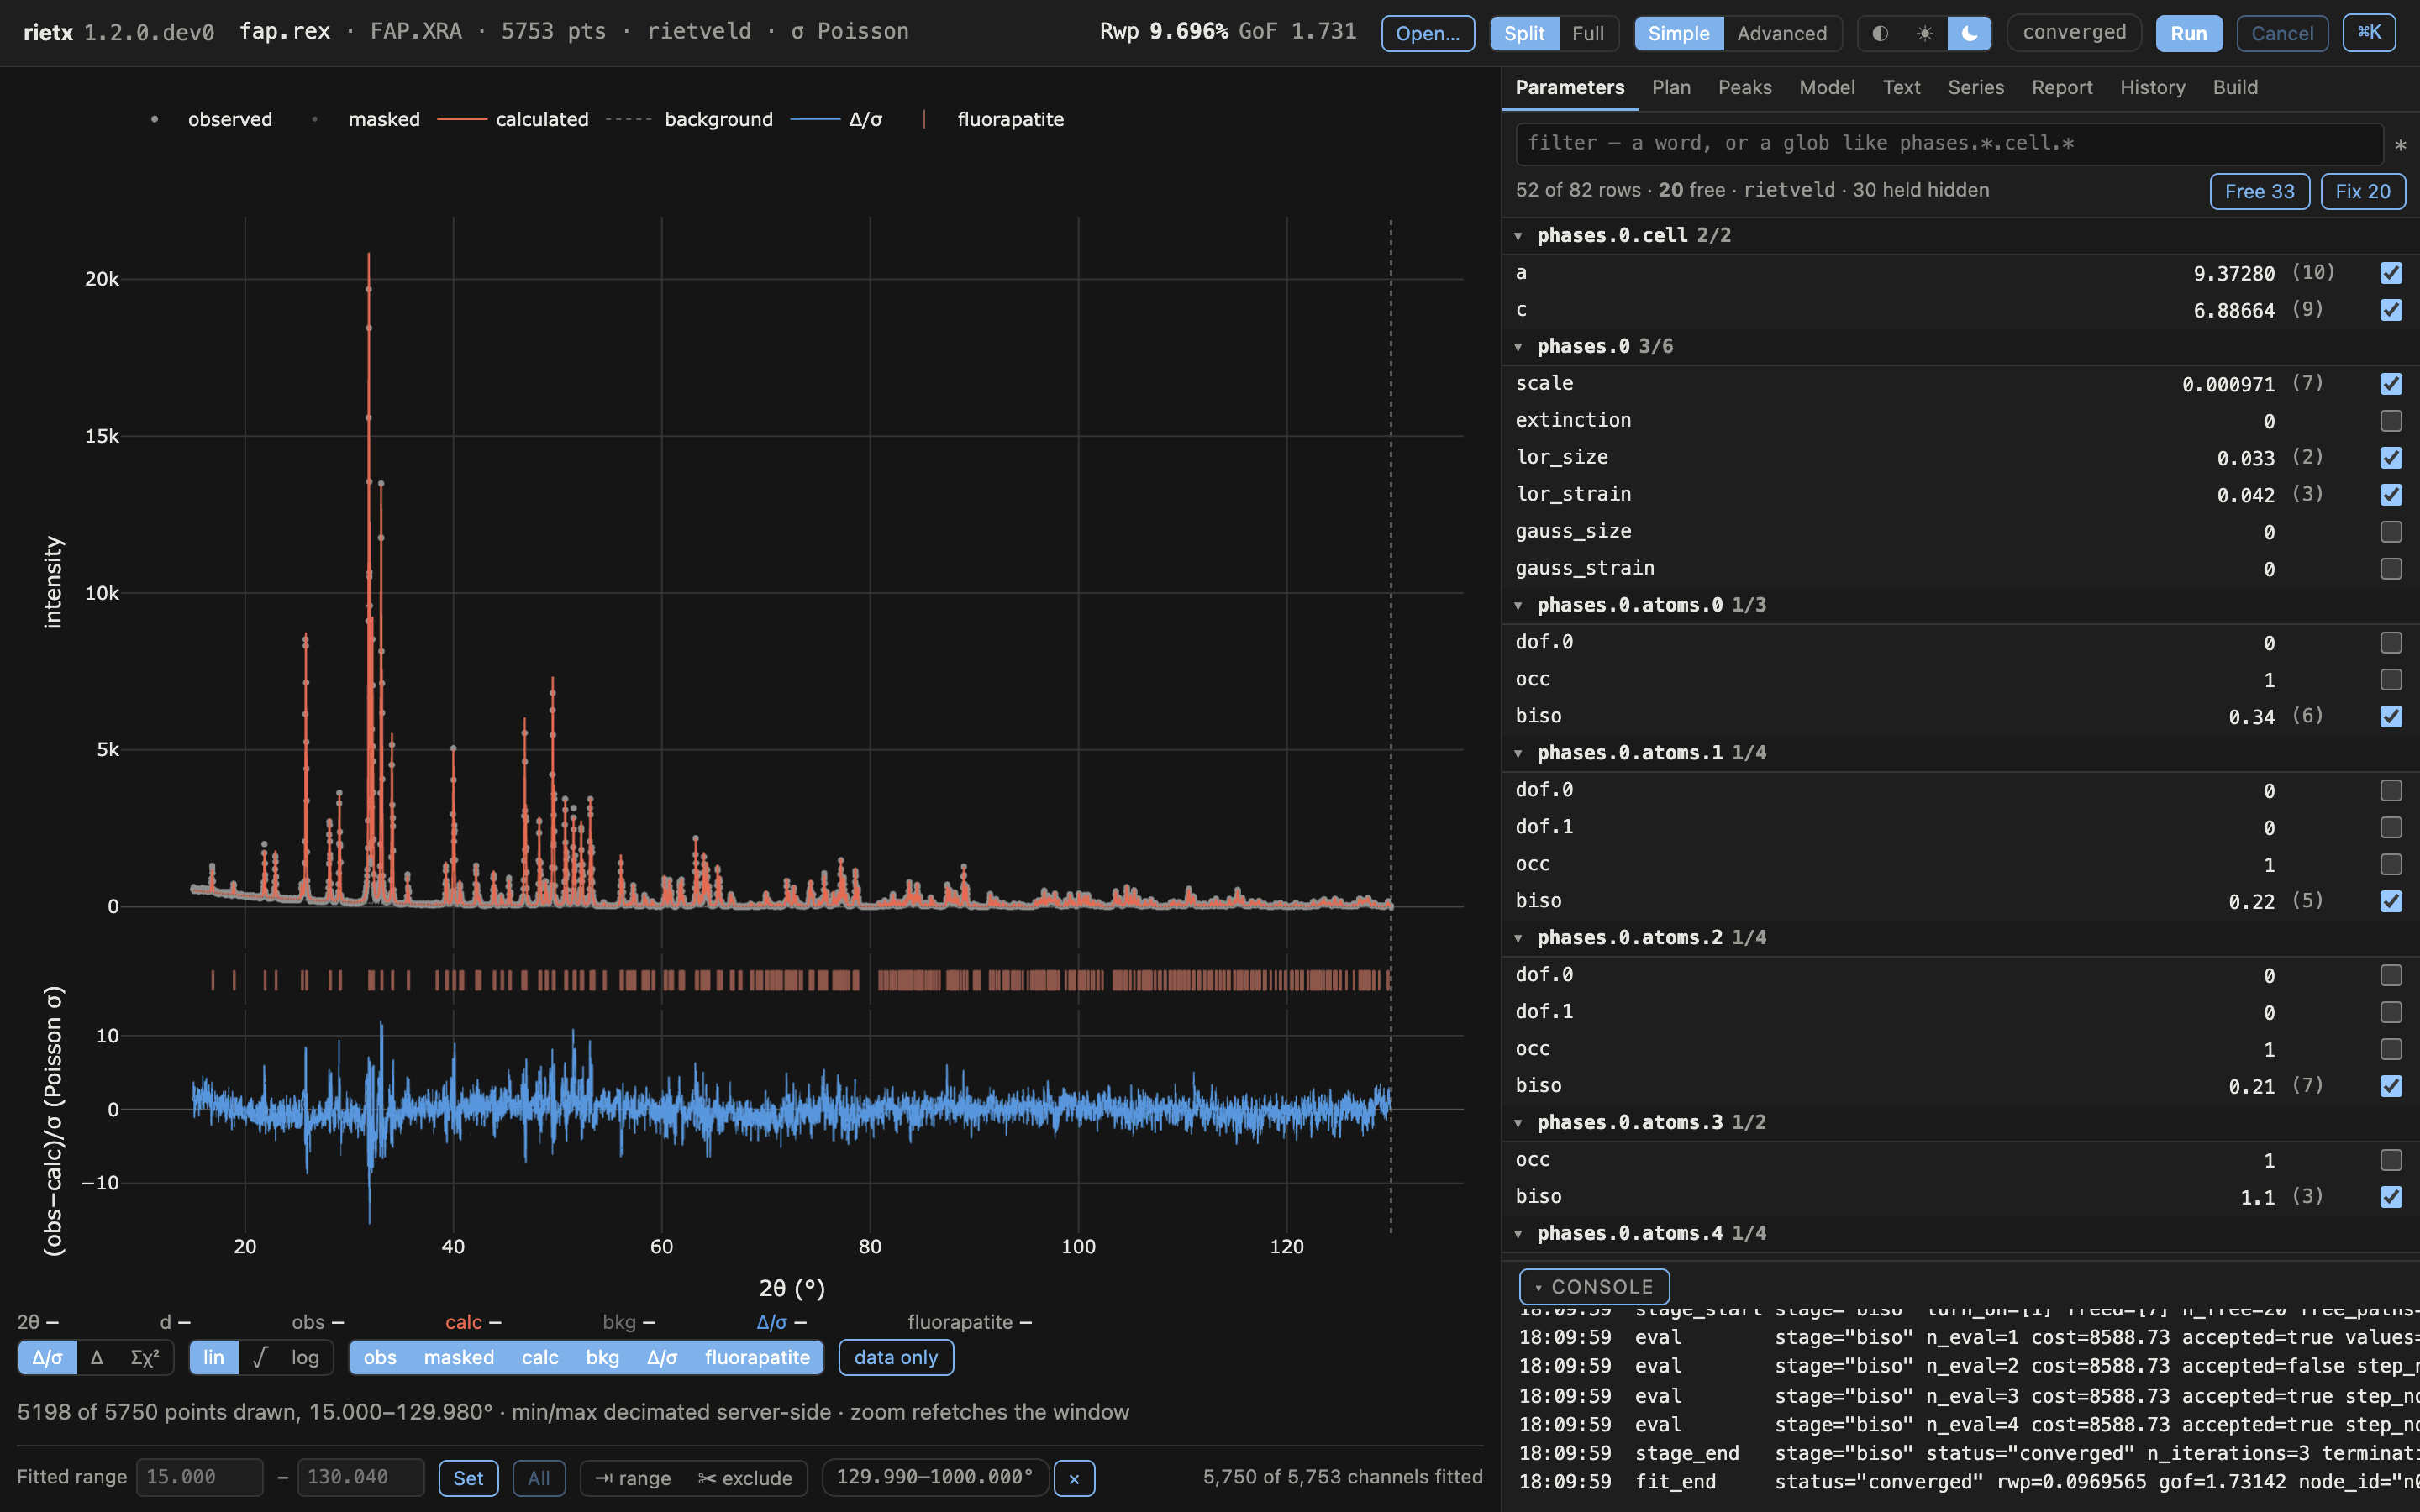
Split | Full in the header chooses how much of the window that column gets,
and the tabs travel with it. The tab is where you are and the layout is how wide
it is. There are no modes.
The header also carries the project’s name and pattern, Rwp and GoF once a
fit has run, Simple | Advanced, a three-way theme control (◐ follow the
system, ☀ light, ☾ dark), and Run.
Run the fit
Press Run, or the r key.
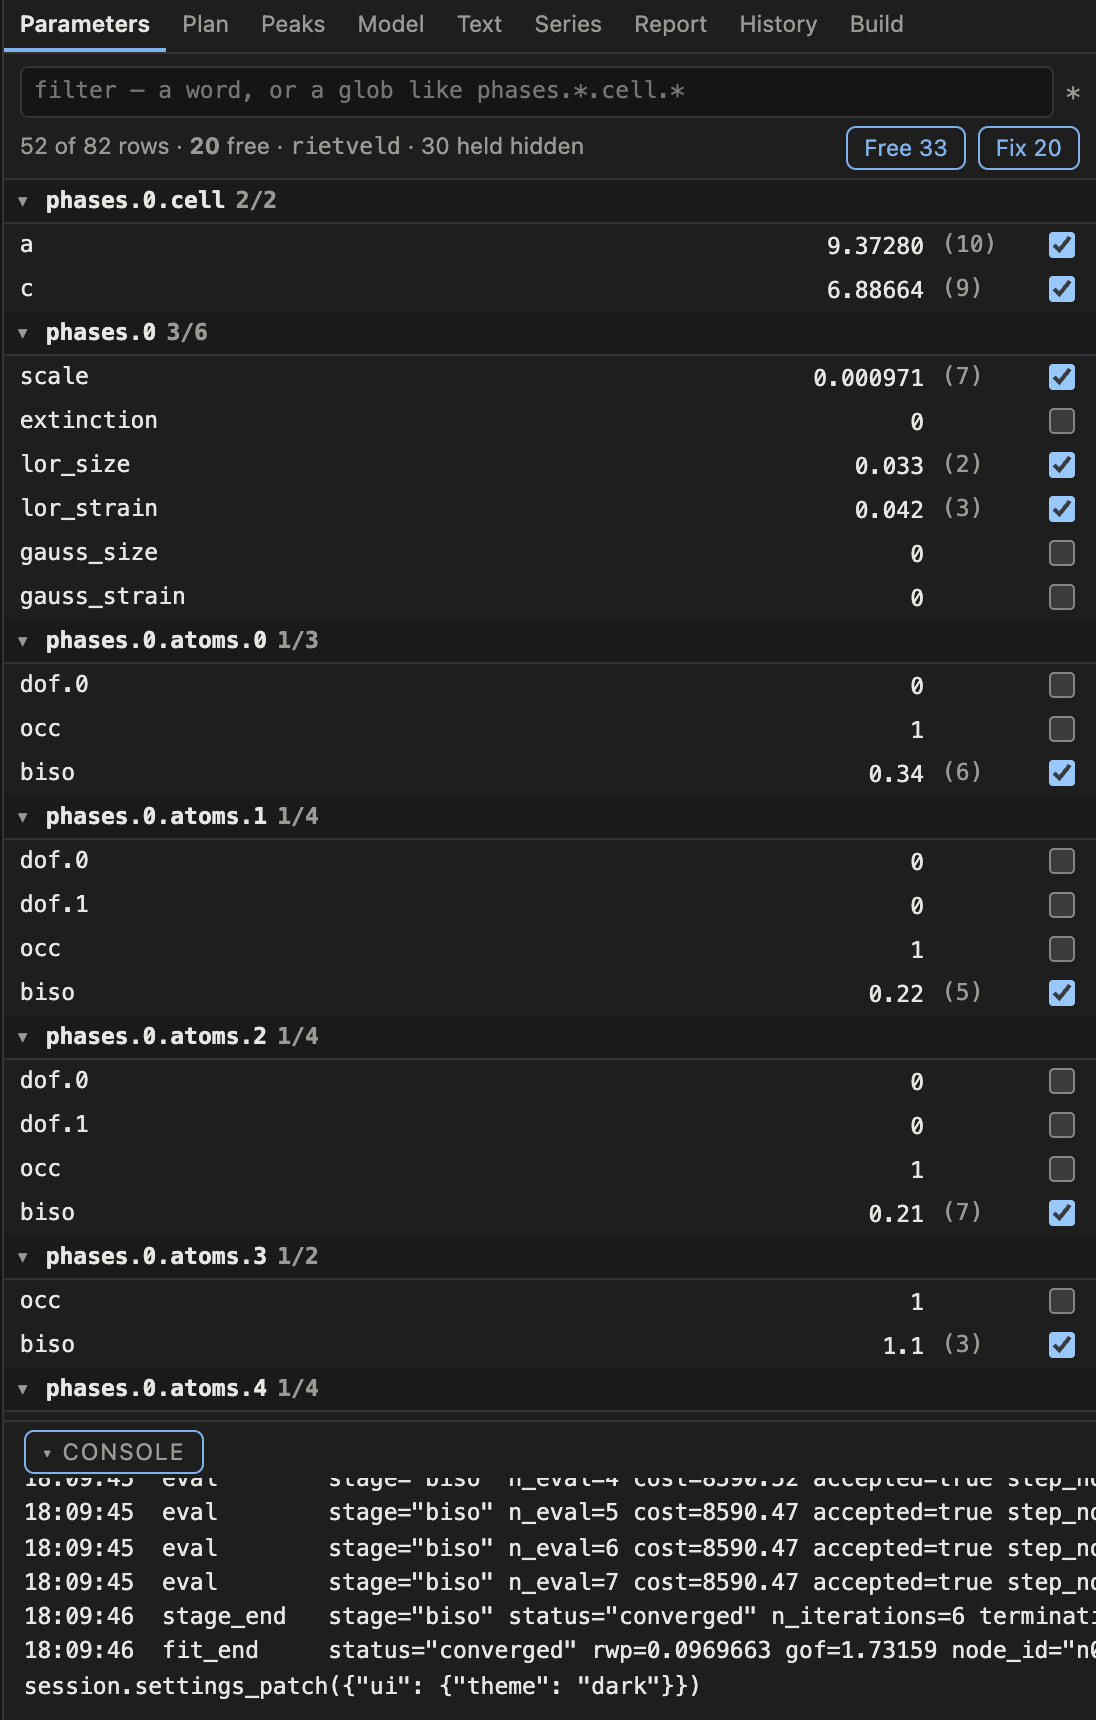
The run pill in the header names the stage and counts them off. Underneath the tab column, the console prints each stage as it starts and finishes, and beside each one the Python call that would have done the same thing. That echo is the on-ramp described in The GUI as a text document and a wire. You can always find out what a button you pressed actually did.
When it stops, Rwp appears in the header. Lower is better. What counts as good
depends on the data, and Reading the numbers has the full account.
A hopeless fit says so
Past an Rwp of 0.35 the header shows ⚠ not a fit yet beside
the number, and the run’s own status pill may still read converged. Both are true: the
optimiser stopped moving, and the model is not yet describing the data. Believe
the warning, and go to the Report.
Read what happened
Look at the plot first. Three curves are drawn over the measured points: the calculated pattern, the background, and underneath them the difference. Structure in the difference curve is the model failing to explain something, and where it sits is the diagnosis. A difference that swings under one peak is a shape or a position problem; one that follows the whole pattern is a scale or a background problem.
Two knobs under the plot change what you can see:
The
residualselector switches the lower panel betweenΔ/σ,ΔandΣχ².Σχ²accumulates the misfit from left to right, so a flat stretch contributed nothing and a step is exactly where the fit is bad. It answers “where is my fit worst?” better than any single number.The intensity scale (
lin,√,log) redraws the same numbers.√makes weak peaks visible without pretending they are strong.
Then open the Report tab. It states what the package is prepared to say about
this fit, and it is built to refuse a confident wrong answer: where two
explanations fit the misfit equally well it says so and names both, instead of
picking one. The fit report is the full account of what those statements mean.
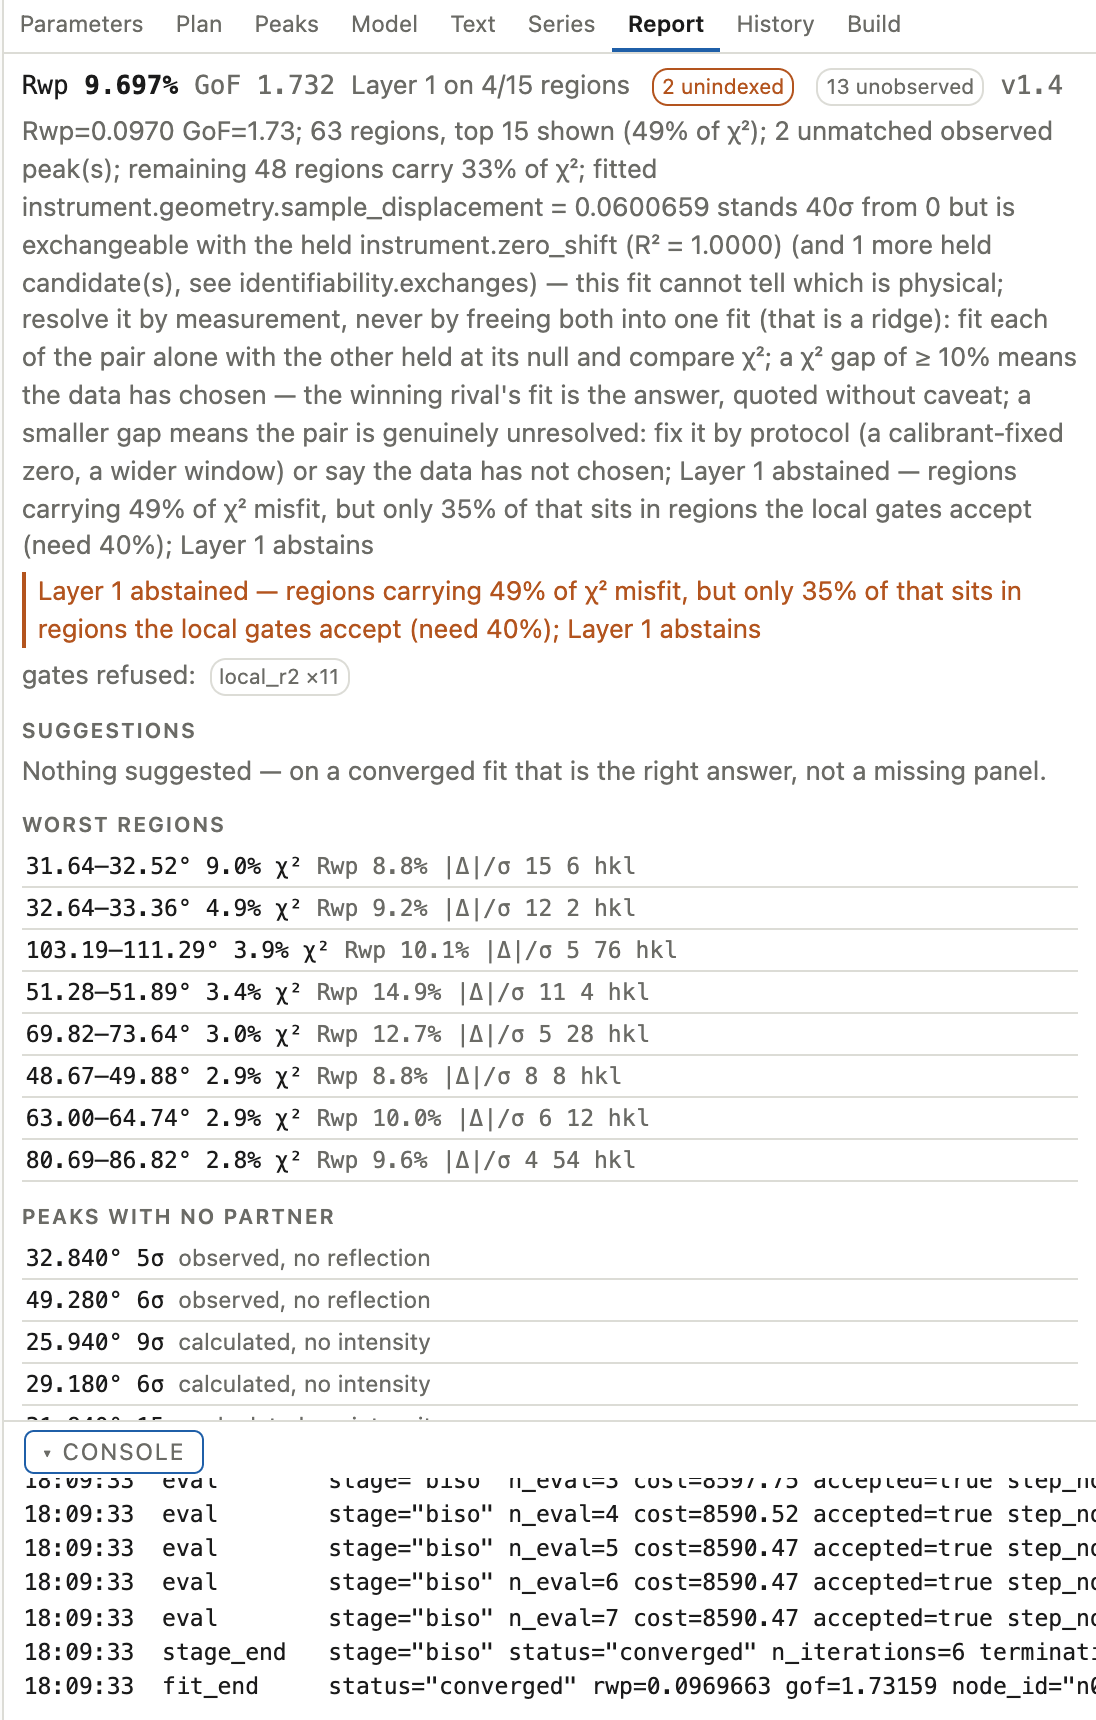
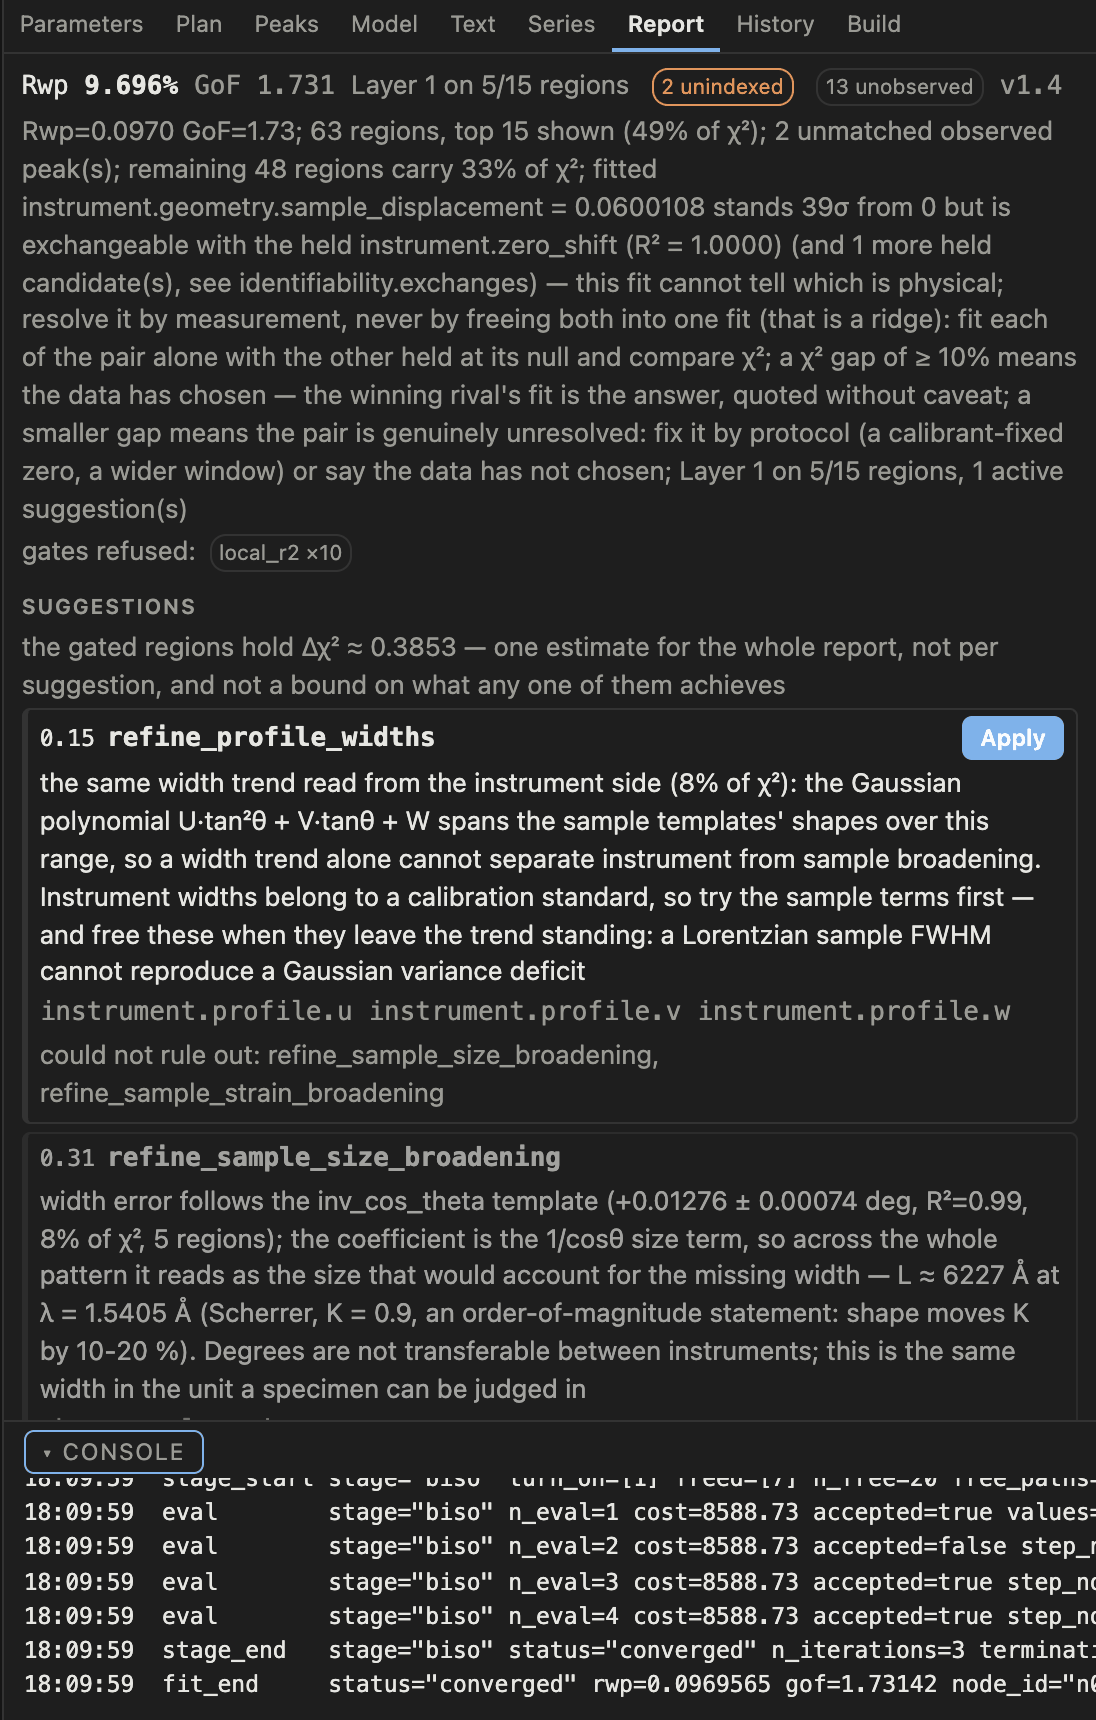
The screenshot above is the fluorapatite example after the run this chapter describes. The report has found a real degeneracy in it: a sample displacement that “stands 39σ from 0 but is exchangeable with the held zero shift”. It says the fit cannot tell which is physical. That is the package declining to give you a confident wrong number, and the rest of the manual keeps referring back to it.
Then your own data
New project… in the Model panel’s header, or Open… in the app header, opens
a four-step wizard:
Pattern. Choose a data file. The step names the reader that claimed it, in the reader’s own words, and shows the options that reader accepts. So a multi-scan vendor file grows a scan picker here and a two-column text file does not. Read the diagnostics it prints: this is where you find out that a scan was stored backwards, or that an attenuator factor has been applied to the counts.Structure. A CIF file, a typed space group and cell, orNone yet. The typed form offers only the cell parameters the symmetry leaves free, so abunder a tetragonal symbol is not a value you can get wrong.None yetmakes a project with no phase, which is the right start when the pattern is what you have and the cell is what you are looking for. See The GUI panel by panel‘s Peaks section.Instrument. A preset per geometry and anode, or a saved instrument profile. The step pre-fills from the data file’s own header where it can, and says why it chose what it chose. Where it says nothing, that silence is deliberate: a header whose anode name and wavelength disagree gets no suggestion, because a wrong pre-fill looks like it was read.Project. Where the.rexdirectory goes, the intensity mode, and the plan. Nothing is written until you pressCreate project.
Choose the anode deliberately
The wizard refuses to default the instrument. A wavelength nobody chose ends up in every cell parameter you go on to refine, and it is invisible in Rwp. The fit is as good as ever and the numbers are wrong. The parameter table has the wavelength/cell degeneracy in full.
Where to go next
The GUI panel by panel: the nine panels, and when to branch the history.
The GUI as a text document and a wire: the
.rxttext document, the keyboard, and the routes.A first refinement: the same first fit written as a Python script.
Running a refinement: what the stages of a plan are actually doing.